
FIGURE 2.
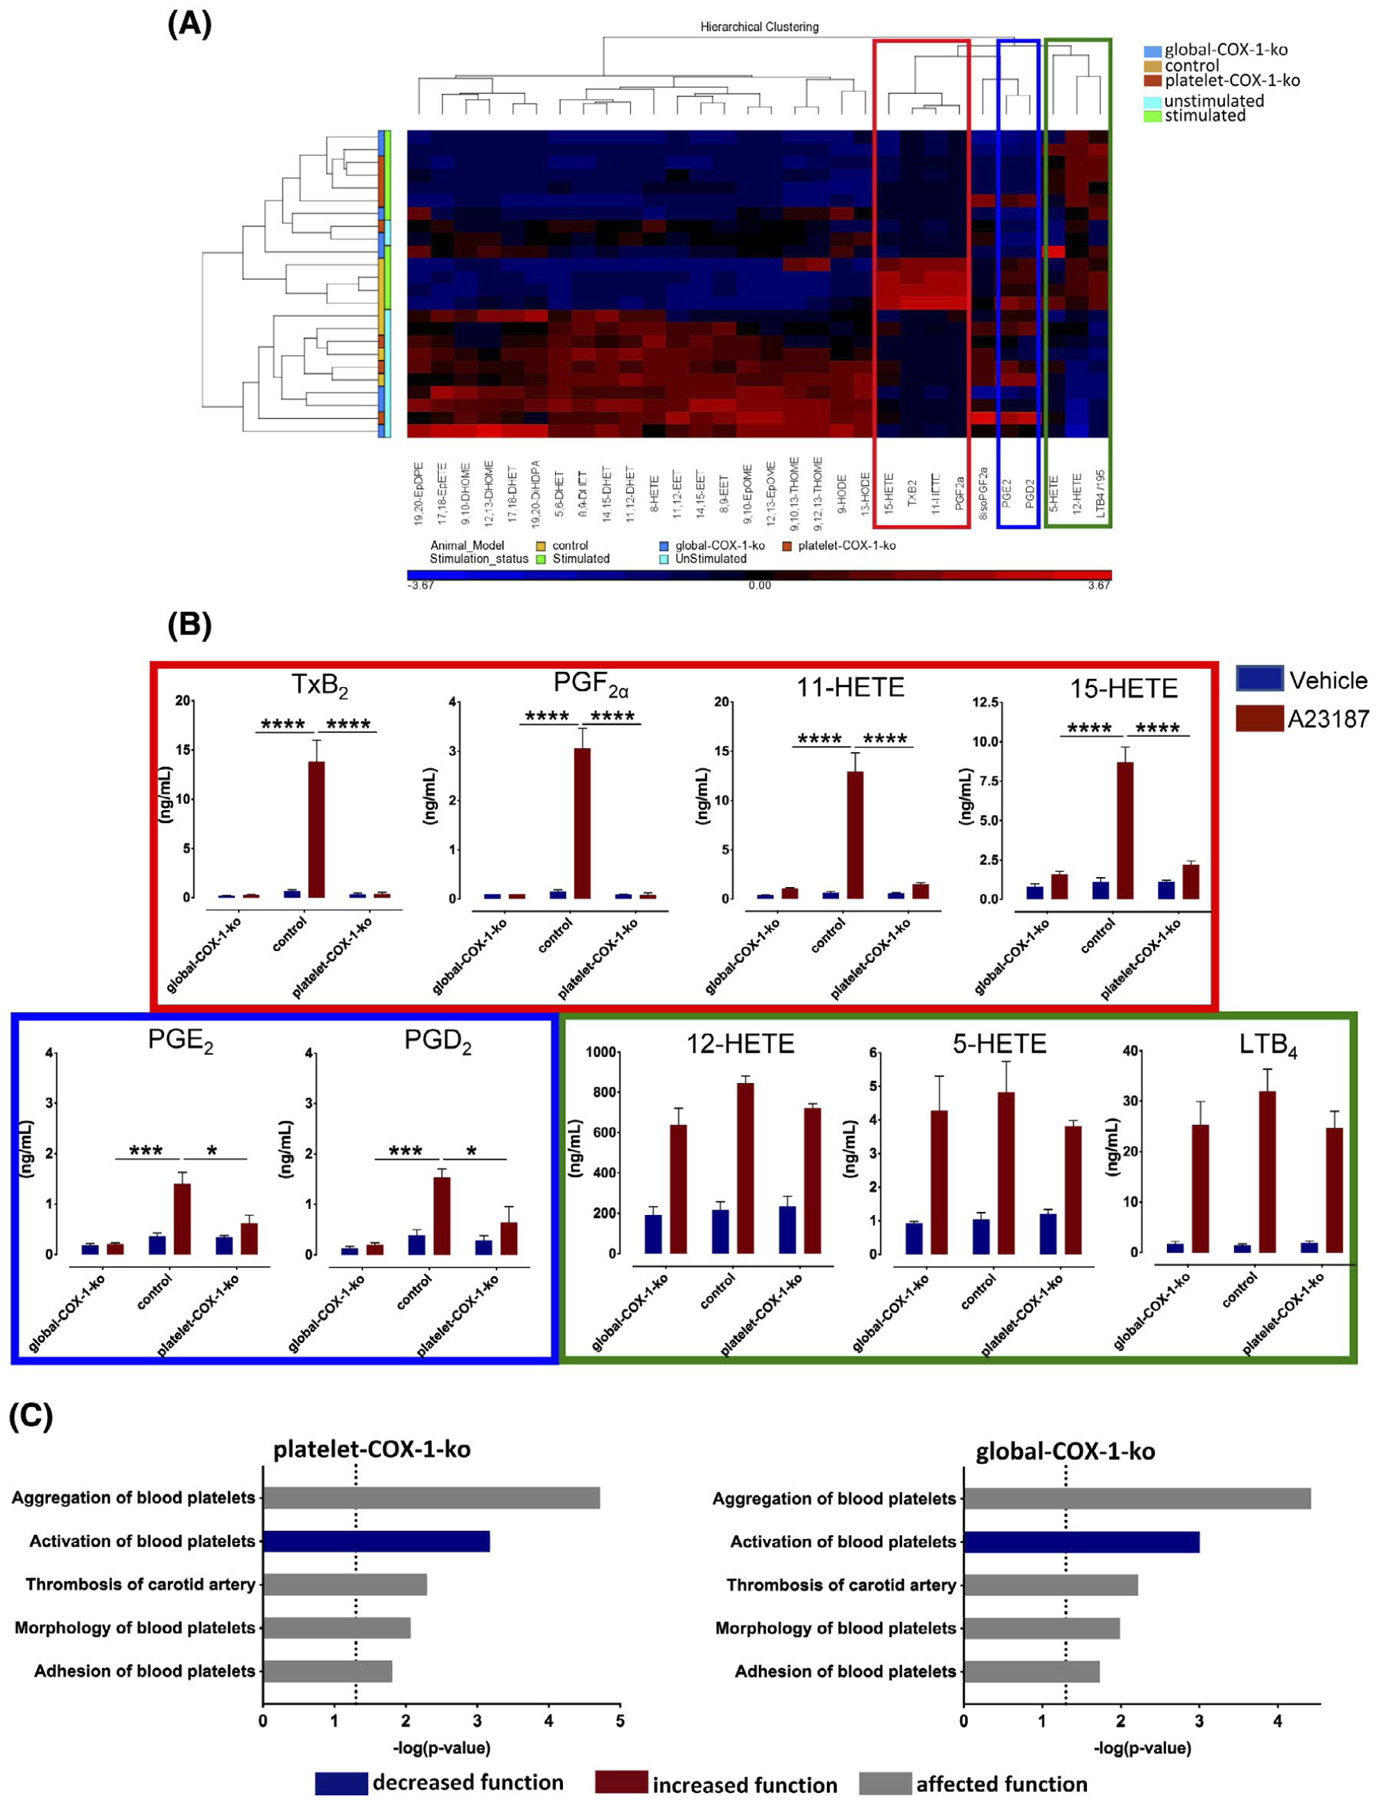
Tandem mass spectrometry analysis of lipid mediators produced in whole blood and IPA predictions of platelet activation and thrombosis. Plasma samples were prepared from mouse blood following incubation in vitro with vehicle or A23187 (50 μM) in stirring conditions (1000 rpm, 5 minutes) and subjected to tandem mass spectrometry analysis. A, Relative levels of mediators displayed in a heat map using a Z-score ranging from −4.12 (blue) to 4.12 (red). The individual products are represented on the bottom horizontal bar and their clustering on the top, while on the left the metabolites are grouped according to stimulated and unstimulated conditions and to the mouse strain. Hierarchical clustering analysis identified three different clusters of eicosanoids whose levels are significantly increased upon stimulation of whole blood with A23187 (50 μM): the cluster including TxB2, PGF2α, 11-HETE, and 15-HETE is indicated in the red box; the cluster including PGE2 and PGD2 is indicated in the blue box; and the cluster comprising 12-HETE, 5-HETE, and LTB4 in the green box. B, The absolute plasma levels of these eicosanoids as measured by tandem mass spectrometry. Results are from n = 4 global-COX-1-ko, control, and platelet-COX-1-ko mice for each vehicle or A23187 treatment and were analyzed by two-way ANOVA followed by Tukey’s test. Data are presented as means ± SEM. *P < .05, **P < .01, ***P < .001, and ****P < .0001. C, IPA and downstream effects analysis were used to predict the cellular events related to platelet reactivity and thrombosis affected by the increase or decrease of AA-derived eicosanoids synthesis by COX in vitro in platelet-COX-1-ko mice and global-COX-1-ko mice. In the bar charts, the disease and function categories involved in this analysis are displayed along the y-axis. The x-axis displays the −(log) significance. Longer bars are more significant than shorter bars. Functions are listed from most significant to least and the vertical dotted line denotes the cutoff for significance (P value of .05). Blue and grey indicates diseases or functions that are predicted as decreased or affected, respectively.