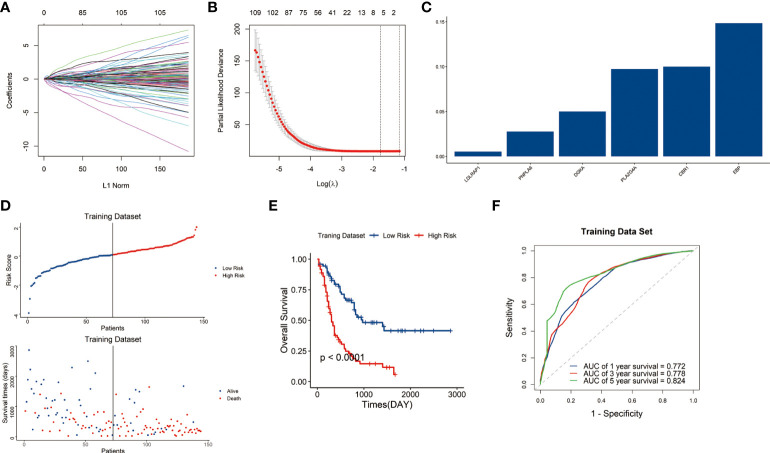
Figure 1.
Construction of the lipid metabolism-related risk signature in the TCGA cohort. (A) Tuning parameters of OS-related genes to cross-verify the error curve. (B) Perpendicular imaginary lines to calculate the minimum criteria. (C) LASSO regression coefficient for each of six signature genes. (D) Distribution of the risk score and survival status of each sample. (E) Survival status of patients in the two risk groups classified by the signature. (F) ROC curves to predict the 1-, 3-, and 5-year survival.

