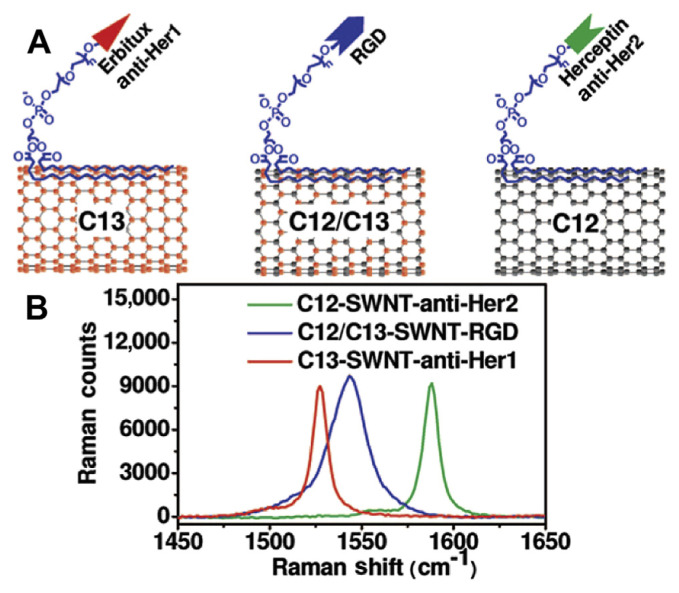
Fig. 12.
Single walled carbon nanotubes (SWNTs) with different Raman colors. (A) schematic SWNTs with three different isotope compositions (C13-SWNT, C12/C13-SWNT, C12-SWNT) conjugated with different targeting ligands. (B) Solution phase Raman spectra of the three SWNT conjugates under 785 nm laser excitation. Different G-band peak positions were observed. At the same SWNT concentration, the peak height of C12-SWNT (Hipco) was approximately two times higher than that of C13-SWNT and approximately four times higher than that of C12/C13-SWNT. For mixtures used in biological experiments, concentrations of the three SWNTs were adjusted to give similar G-band peak intensities of the three colors, as shown in this figure. Note. From “Multiplexed multicolor Raman imaging of live cells with isotopically modified single walled carbon nanotubes,” by Z. Liu, X. Li, S.M. Tabakman, et al, 2008, J Am Chem Soc, 130, p. 13540–1. Copyright 2008, American Chemical Society. Reprinted with permission.

