Figure 3.

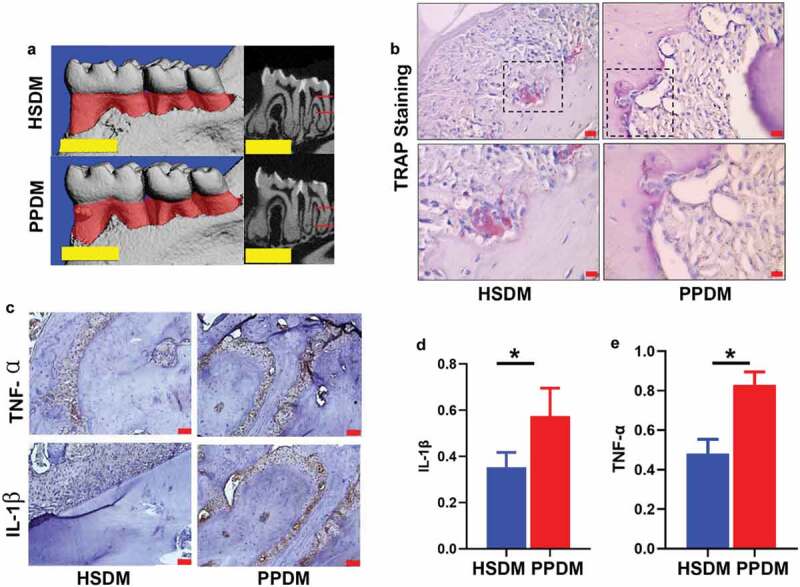
Oral manifestation in recipient mice after human oral microbiome transplantation. (a) microCT images of periodontal tissues at endpoint; scale bar: 1 mm; (b) TRAP staining. Boxes in upper panel are shown magnified in lower panel; scale bar: 50 μm. (c) IHC staining of TNF-α (upper panel) and IL-1β (lower panel); scale bar: 50 μm. AOD quantification of TNF-α (d) and IL-1β (e) in IHC images. HSDM: healthy subject donated microbiome recipient mice; PPDM: periodontitis patient donated microbiome recipient mice; *(p < 0.05) indicates statistically significant difference between groups. N.S: not significant. N = 3 for each group.
