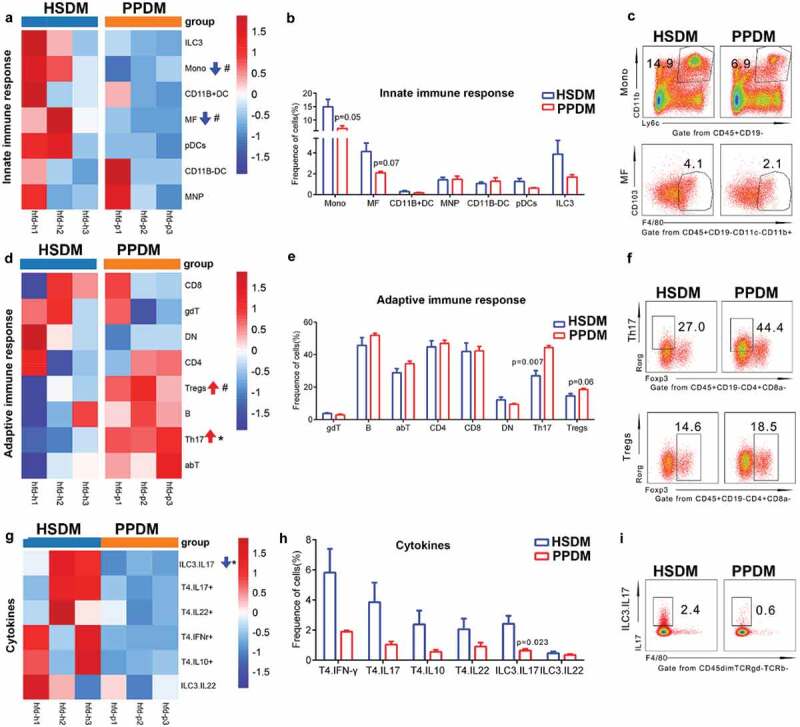
Figure 4.

Comparison of innate (a–c), adaptive immune cells (d–f) and cytokine production (g–i) between groups at endpoint. Each column represents one sample. a, d, g: Heatmap of average fold change for cells listed in the right of each column; b, e, h: frequency comparison between groups; c, f, i: scatter plot of cells with significantly different distribution. HSDM: healthy subject donated microbiome recipient mice; PPDM: periodontitis patient donated microbiome recipient mice; DC: dendritic cell; pDCs: plasmacytoid dendritic cells; Mono: monocyte; MNP: mononuclear phagocyte; MF: macrophage; ILC: innate lymphocyte cell; ILC3: innate lymphocyte cell type 3; abT: TCRαβ T cell; gdT: TCRγδ T cell; B: B cell; CD4+: CD4+ cell; CD8+: CD8+ cell; DN: CD4-CD8- T cell; Th17: Th17 T cell; Treg: Foxp3+ regulatory T cell. T4.IFNγ: CD4 + T cell produced IFNγ; T4.IL10+: CD4 + T cell produced IL10; T4.IL17+: CD4 + T cell produced IL17; T4.IL22: CD4 + T cell produced IL22; ILC3. IL17: ILC3 produced IL17; ILC3. IL22: IL3 produced IL22. # indicates p < 0.1 and * indicates p < 0.05. N = 3 for each group.
