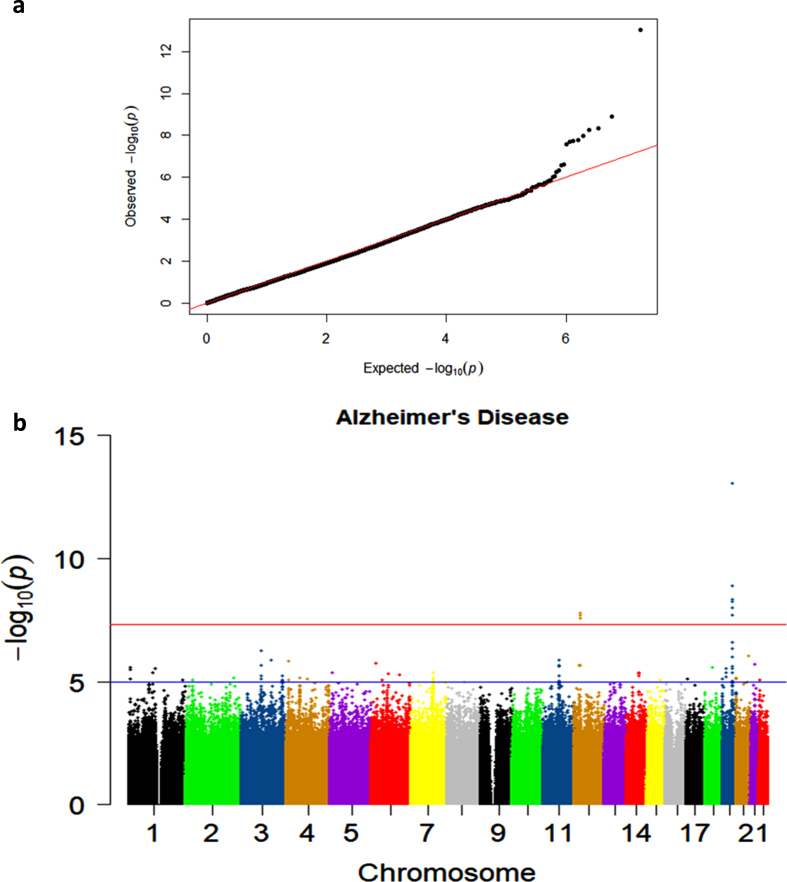
Fig. 1.
a) Quantile-quantile plot showing observed versus expected p-values for the AD Dementia analysis. b) Manhattan plot showing genome-wide p-values for the association with AD. The threshold for genome-wide significance (p < 5E-08) is indicated by the red line and the threshold for suggestive significance (p < 1E-05) is indicated by the blue line.

