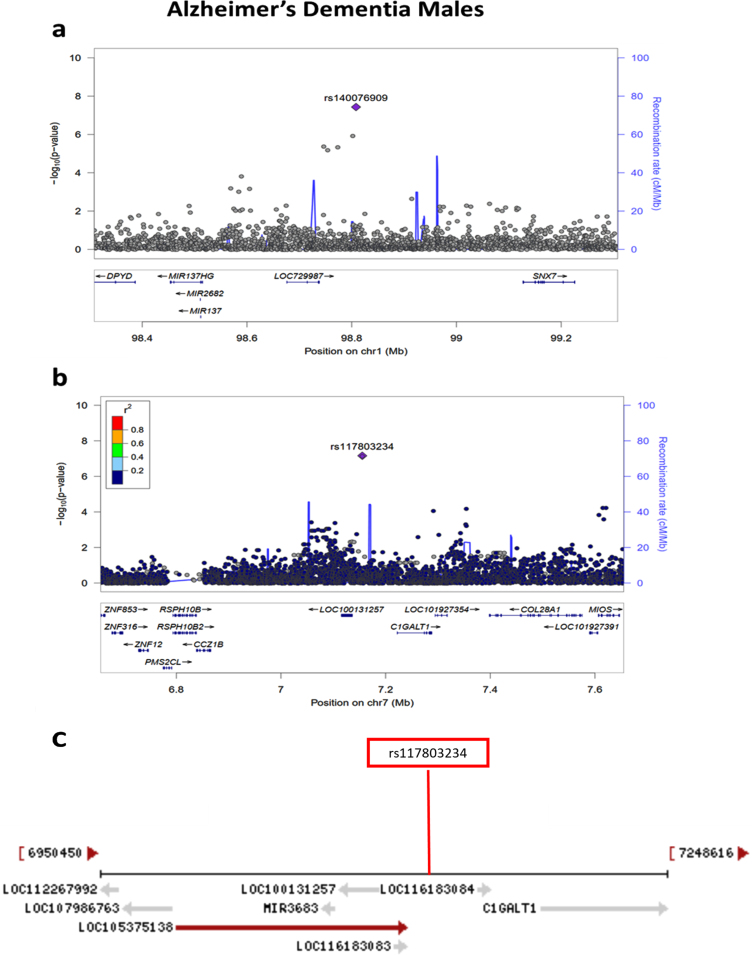
Fig. 6.
a) Regional association plot on chromosome 1 centered around the most significant SNP, rs140076909 (p = 3.72E-08) based on GRCh37 assembly. b) Regional association plot on chromosome 7 centered around the most significant SNP, rs117803234 (p = 6.93E-08) based on GRCh37 assembly. c) Locations of predicted genes and top SNP, rs117803234 relative to LOC100131257, LOC105375138, and LOC116183083 based on the NCBI’s gene prediction program Gnomon and GRCh38 assembly.

