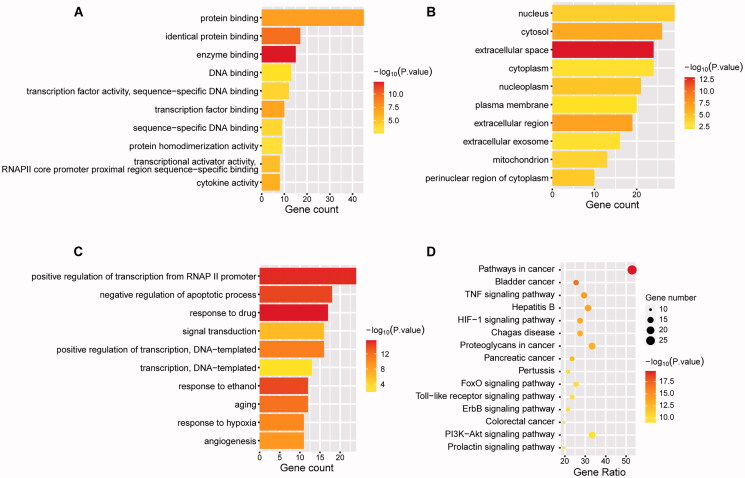
Figure 4.
Enrichment analysis of Gene ontology and KEGG pathway. 52 targets with a degree greater than the median were applied for enrichment analysis. Gene Ontology including biological processes (A), cellular components (B), molecular functions (C), and KEGG pathway (D) was analysed by DAVID. The statistical significance threshold of enrichment analysis was established at p < 0.05.

