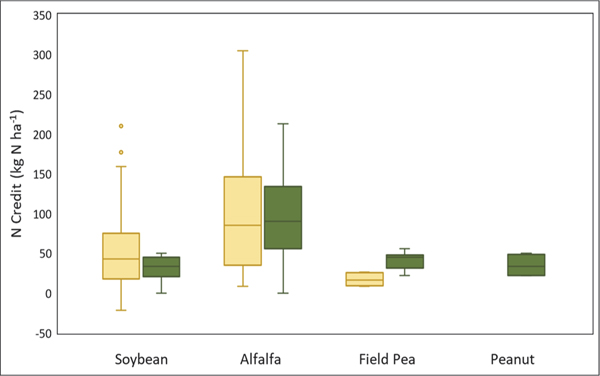
Figure 2.
Box plots showing the reported legume N credits recommended by U.S. land grant university cooperative extension services (green, right) and determined empirically by peer-reviewed studies (yellow, left). The 10th percentile is represented by the lower whisker, the 25th percentile is represented by the bottom of the box, the median is represented by the line in the middle of the box, the 75th percentile is represented by the top of the box, and the 90th percentile is represented by the top whisker. There were 23 universities with soybean N credits, 26 with alfalfa credits, 6 with field pea credits, and 3 with peanut credits (34 universities were included, representing 34 states). There were 18 studies that reported soybean N credits, 12 that reported alfalfa credits, 2 that reported field pea credits, and 0 that reported a peanut N credit (results from 27 studies were included in the dataset, across 11 U.S. states and 3 Canadian provinces).

