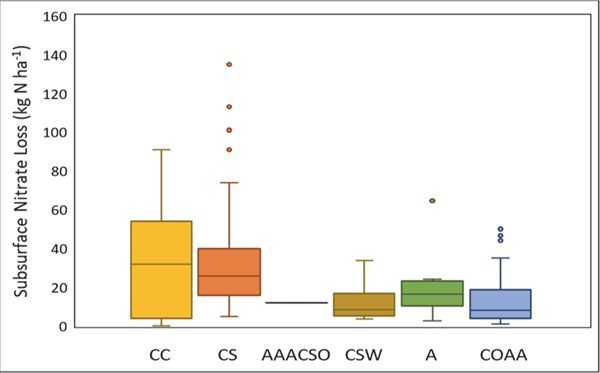
Figure 3.
Box plots showing the reported data from the literature on the effects of crop rotation on water quality, specifically for subsurface nitrate-N losses. The 10th percentile is represented by the lower whisker, the 25th percentile is represented by the bottom of the box, the median is represented by the line in the middle of the box, the 75th percentile is represented by the top of the box, and the 90th percentile is represented by the top whisker. Cropping systems are labeled with crops in the order in which they appear in the rotation (C = corn (Zea mays [L.]), S = soybean (Glycine max [L.] Merr.), A = alfalfa (Medicago sativa [L.]), W = winter wheat (Triticum aestivum [L.]), and O = oat (Avena sativa [L.]). There were 12 studies that reported nitrate losses for CC, 16 for CS, 1 for AAACSO, 1 for CSW, 4 for A (continuous alfalfa), and 2 for COAA.

