
Figure 1.
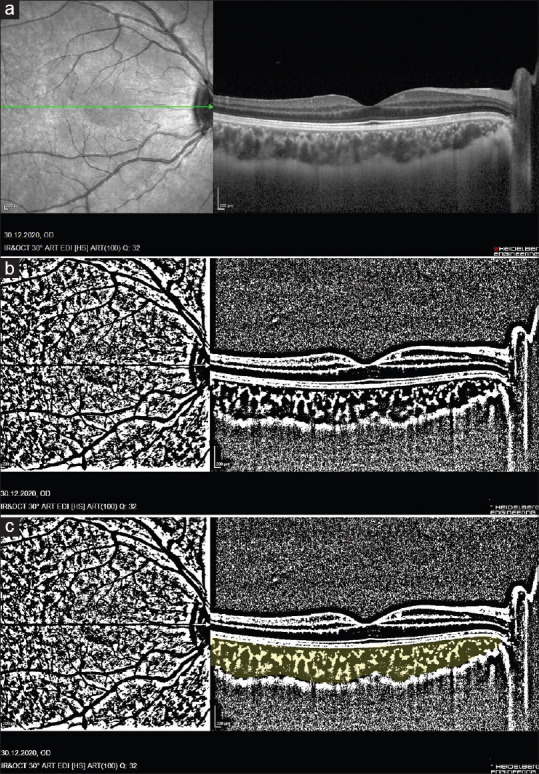
(a) Enhanced-depth optical coherence tomography image. (b) The image was binarized using Niblack’s auto-local threshold. (c) The color threshold tool was used to select the dark pixels, representing the luminal area
Official websites use .gov
A
.gov website belongs to an official
government organization in the United States.
Secure .gov websites use HTTPS
A lock (
) or https:// means you've safely
connected to the .gov website. Share sensitive
information only on official, secure websites.
(a) Enhanced-depth optical coherence tomography image. (b) The image was binarized using Niblack’s auto-local threshold. (c) The color threshold tool was used to select the dark pixels, representing the luminal area