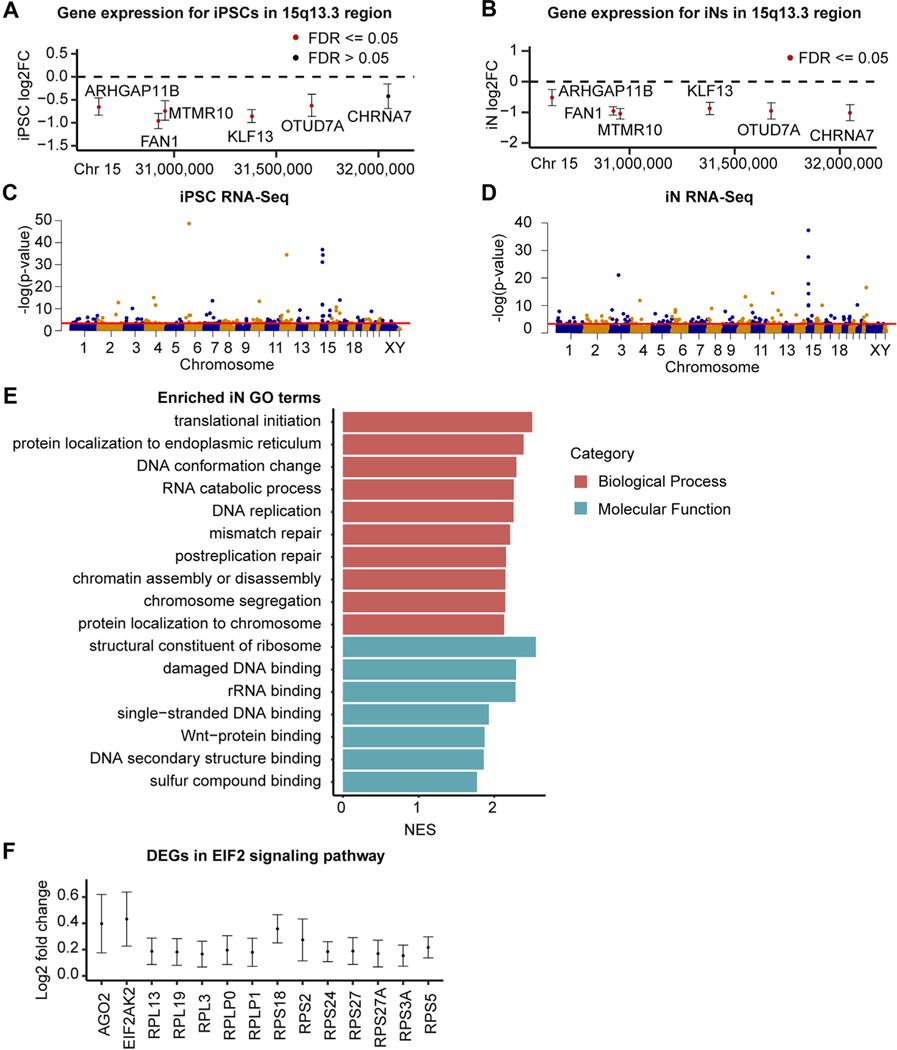
Figure 2.
Gene expression changes within the 15q13.3 microdeletion and genome wide. (A, B) Log2 FC of protein-coding 15q13.3 genes in deletion samples compared with control subjects in iPSCs (A) and iNs (B) (95% confidence intervals shown). (C, D) Manhattan plots of RNA-Seq genes in iPSCs (C) and iNs (D), with the red threshold line indicating .05 FDR significance. (E) Significant GO terms from gene set enrichment analysis of 15q13.3 iN RNA-Seq dataset. The top 10 terms in each category based on FDR are listed, ordered by NES. (F) Log2 FC of EIF2 signaling genes differentially expressed in deletion iNs compared with control iNs (95% confidence intervals shown). Chr, chromosome; DEG, differentially expressed gene; FC, fold change; FDR, false discovery rate; GO, Gene Ontology; iN, induced neuron; iPSC, induced pluripotent stem cell; NES, normalized enrichment score; rRNA, ribosomal RNA; RNA-Seq, RNA sequencing.

