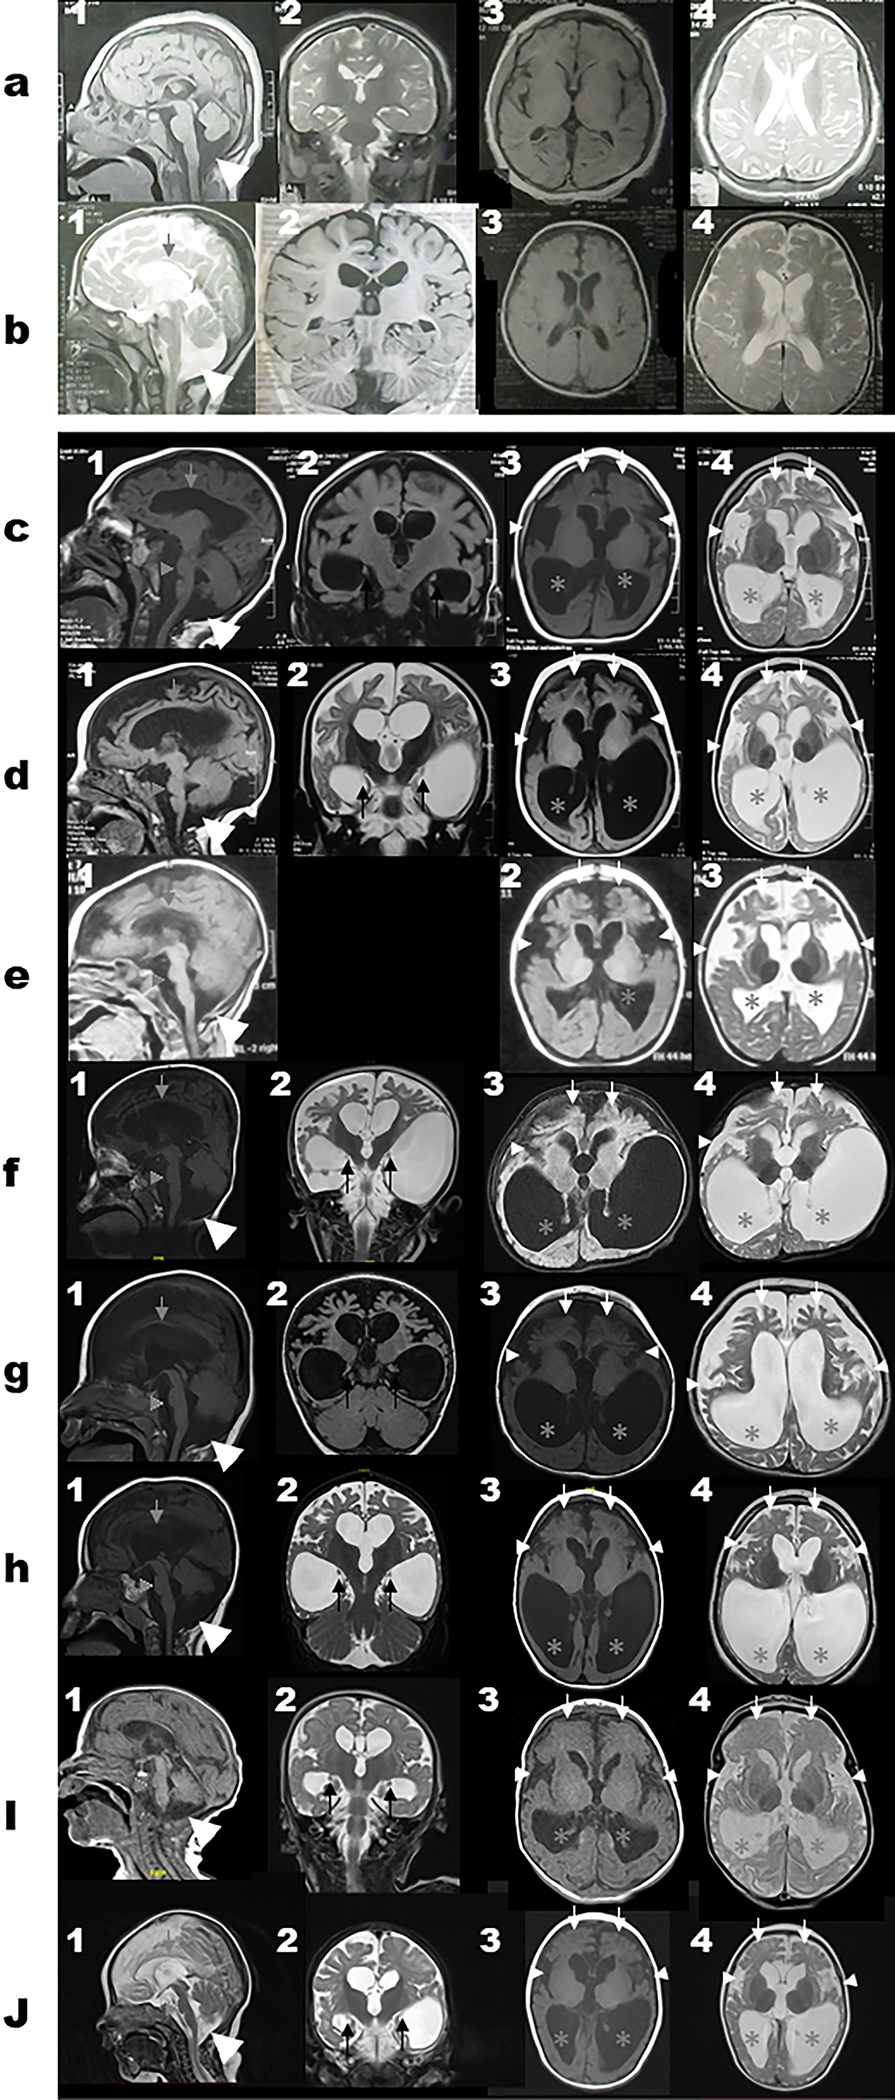
Figure 3. Brain MRI images for subjects with biallelic variants in WDR45B.

Select MRI brain images of Subject 1 (a1–4), Subject 2 (b1–4), Subject 4 (c1–4), Subject 5 (d1–4), Subject 6 (e1–3), Subject 7 (f1–4), Subject 8 (g1–4), Subject 9 (h1–4), Subject 11 (i1–4), and Subject 12 (j1–4). First column represents T1-weighted mid-sagittal images; Second column represents T1-weight or T2-weight coronal images; Third column represents T1-weight axial images while the fourth column represents T2-weight axial images. The white horizontal line separates panels a and b (for Subjects 1–2 with missense variant (c.674G>A; p.R225Q) and panels c-h (for the subjects with the loss of function variants) to show the differences in the MRI features seen in both groups. The cerebral atrophy and giant cisterna magna (large white arrow heads) are seen on panels 1a-1j. Corpus callosum thinning (grey arrows) and brainstem volume loss with flattening of belly of pons (grey arrow heads) seen in 1b-1j. Dysplastic hippocampi (black arrows) can be seen on the coronal images on panels 2c-2j. The disproportionate frontal lobe atrophy (white arrows), symmetric under-opercularization (small white arrow heads), and posterior-horn predominance pattern of the ventriculomegaly (grey asterisks) are best seen on panels 3c-3j and 4c-4j.
