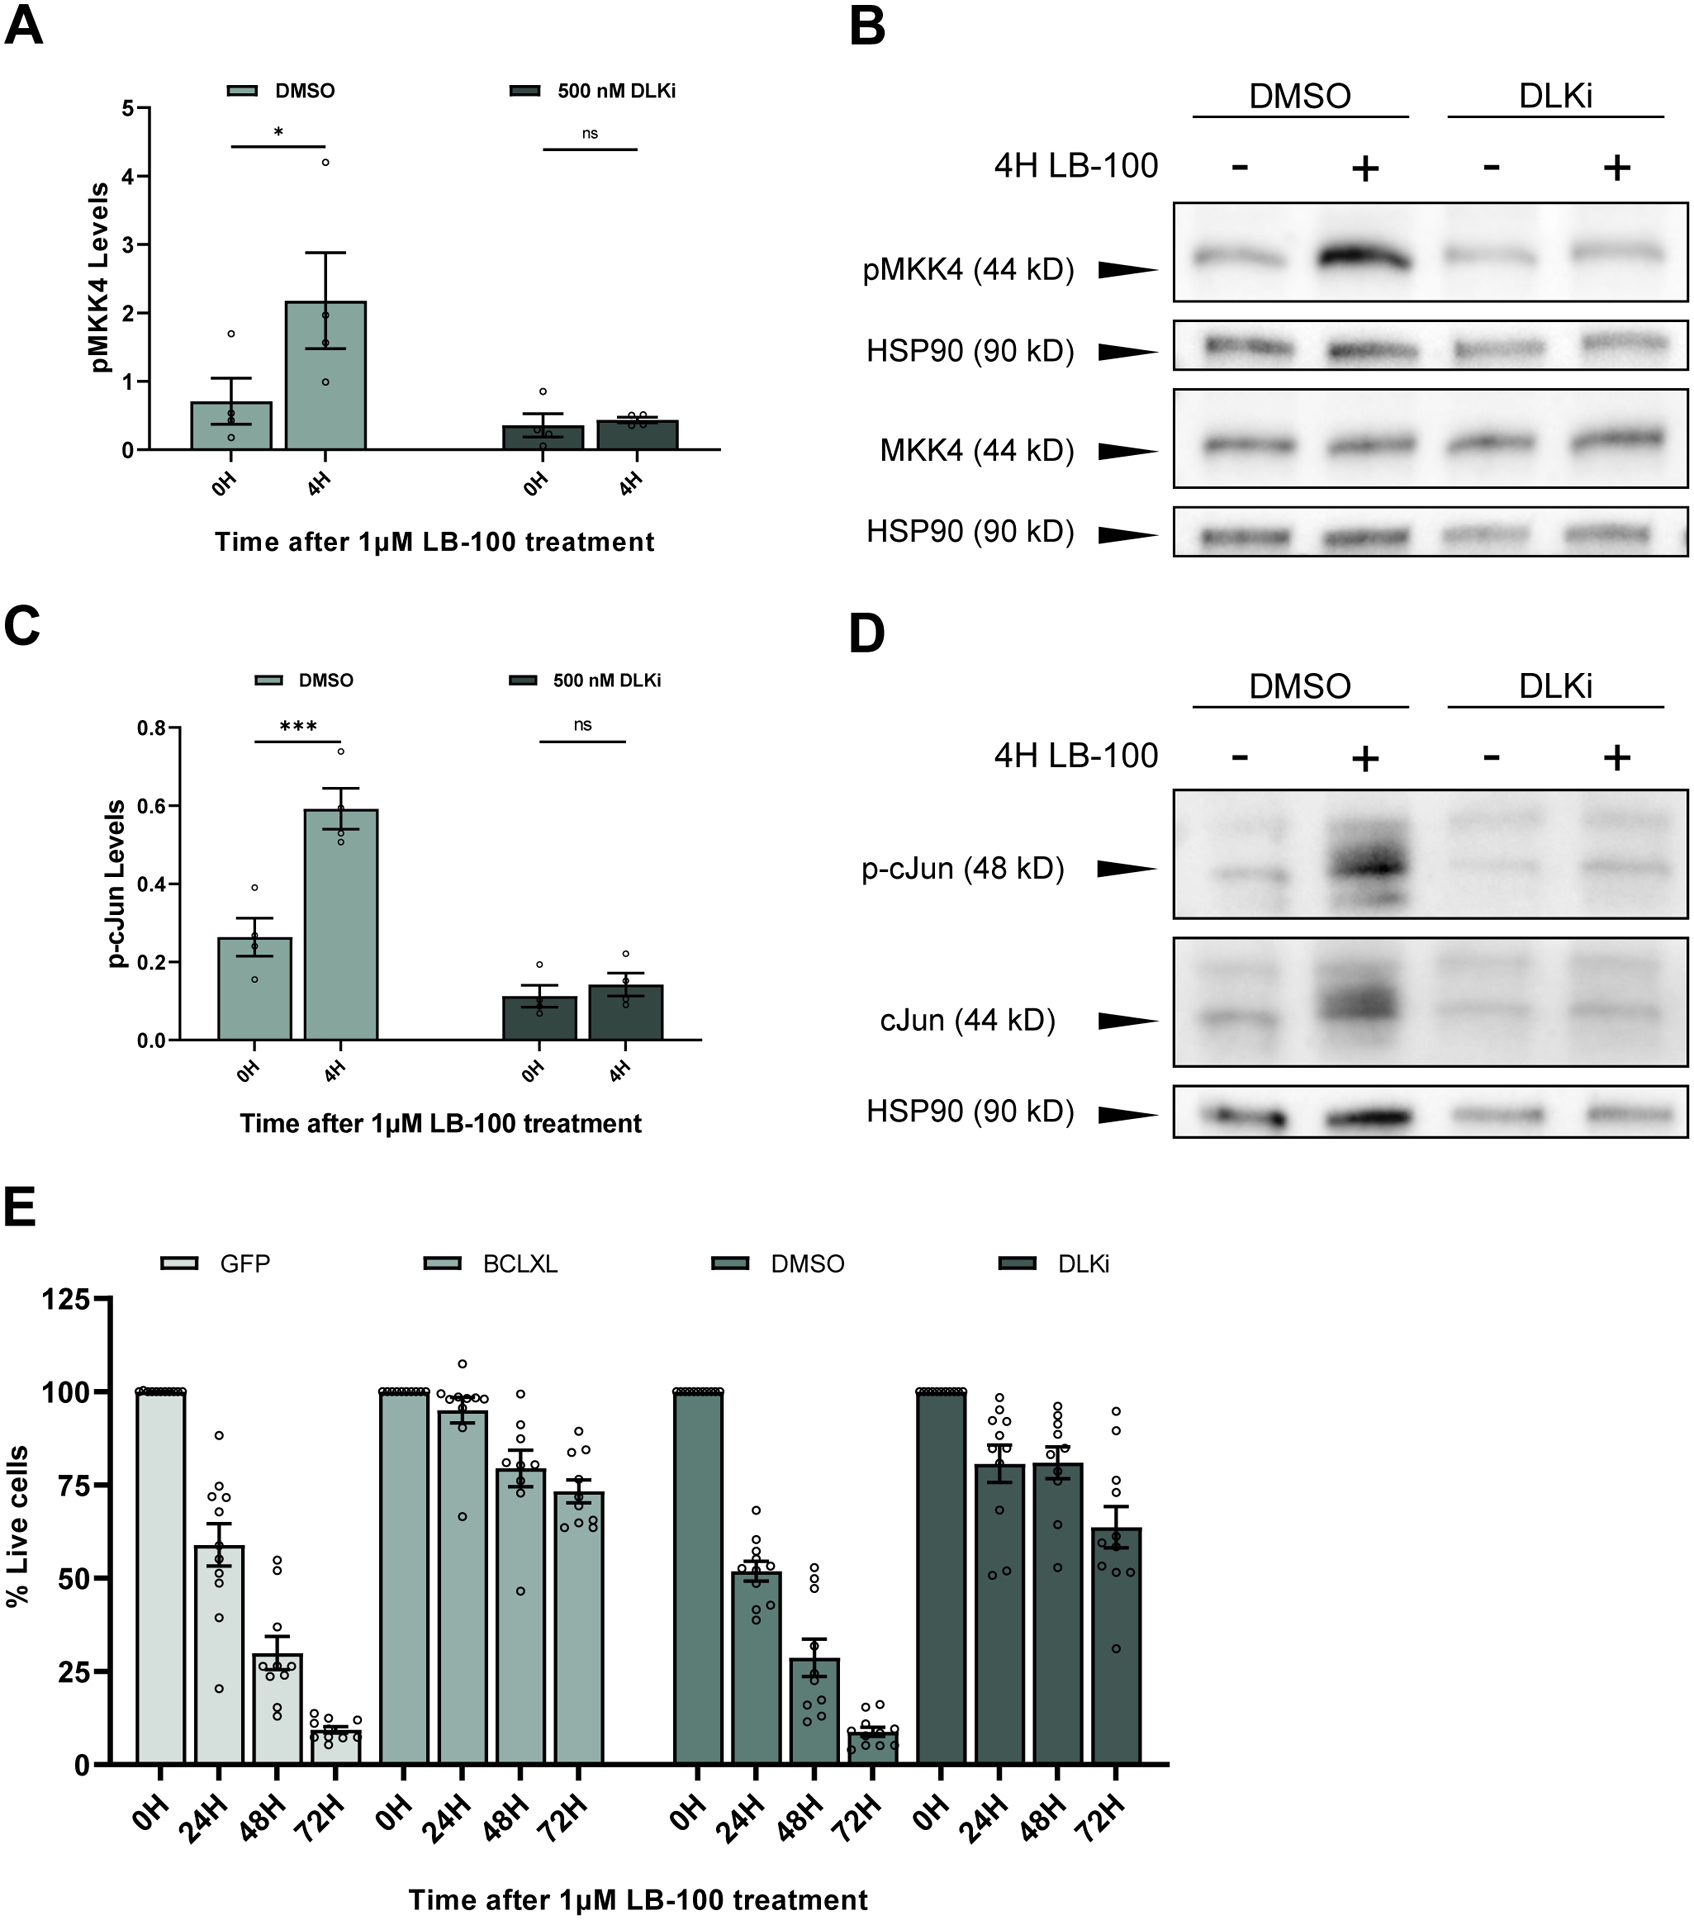
Figure 3. PP2A inhibition in mammalian cortical neurons induces DLK-dependent cell death.

(A) Quantification of the mean (± SEM) levels of pMKK4 in mouse cortical neurons after 4 hours of LB-100 treatment. pMKK4 levels significantly increase following LB-100 treatment in cells pre-treated with DMSO (p = 0.045616) while cells treated 30 minutes prior with 500 nM DLKi do not show an increase in pMKK4 levels (p = 0.988571). Data points represent biological replicates of separate neuronal preps. Statistical analysis was performed using a two-way ANOVA with Šídák’s multiple comparisons test.
(B) Representative Western blots stained for pMKK4 (serine 257/threonine 261) and HSP90 on one blot and MKK4 and HSP90 on a second blot. Primary mouse cortical neurons were treated with 1 μM LB-100 on DIV 12 after being pre-treated by 30 minutes with either DMSO or 500 nM DLKi.
(C) Quantification of the mean (± SEM) levels of phosphorylated cJun in mouse cortical neurons after 4 hours of LB-100 treatment. Phosphorylated cJun levels significantly increase following LB-100 treatment in cell pre-treated with DMSO (p = 0.012677) while cells pre-treated with 500 nM DLKi do not show an increase (p = 0.997312). Data points represent biological replicates of separate neuronal preps. Statistical significance was determined by two-way ANOVA with Šídák’s multiple comparisons test.
(D) Representative Western blots stained for phosphorylated cJun (serine 73), total cJun, and HSP90. Western blot was first probed for phosphorylated cJun, stripped, and re-probed for total cJun. Primary mouse cortical neurons were treated with 1 μM LB-100 on DIV 12 after being pre-treated for 30 minutes with either DMSO or 500 nM DLKi.
(E) Quantification of the mean (± SEM) relative amount of living cells as measured by MTT assay. Biological replicates were normalized to the level of living cells after 0 hours of 1 μM LB-100 treatment for 24 hours, 48 hours, and 72 hours following treatment. Cells were expressing a GFP control or the anti-apoptotic protein BCLXL or were pre-treated for 30 minutes before LB-100 treatment with either DMSO or 500 nM DLKi. Each data point represents a biological replicate which is the average of at least 4 technical replicates. There are significantly more living cells in the BCLXL group compared to the GFP-expressing control group at 24, 48, and 72 hours after LB-100 treatment (p <0.000001, p <0.000001, p <0.000001 respectively). There are significantly more living cells in the DLKi-treated group compared to the DMSO-treated group at 24, 48, and 72 hours after LB-100 treatment (p <0.000001, p <0.000001, p <0.000001 respectively). Each data point represents a biological replicate which is the average of at least 4 technical replicates. Statistical significance was determined by ordinary two-way ANOVA with Šídák’s multiple comparisons test.
