Figure 2.

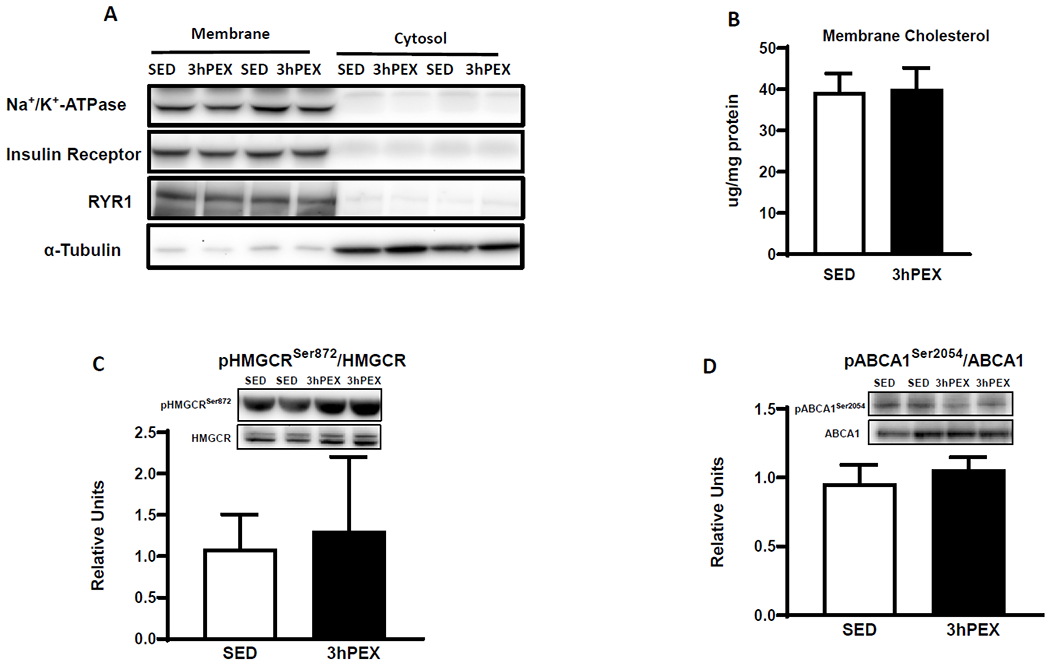
A: Blots of membrane and cytosolic marker proteins, B: Membrane cholesterol content, n=9 per group. C: pHMGCRSer872/HMGCR and D: pABCA1Ser2054/ABCA1, in muscles, n=5-6 per group. Data were analyzed by Student’s t-test, values are means±SD.

A: Blots of membrane and cytosolic marker proteins, B: Membrane cholesterol content, n=9 per group. C: pHMGCRSer872/HMGCR and D: pABCA1Ser2054/ABCA1, in muscles, n=5-6 per group. Data were analyzed by Student’s t-test, values are means±SD.