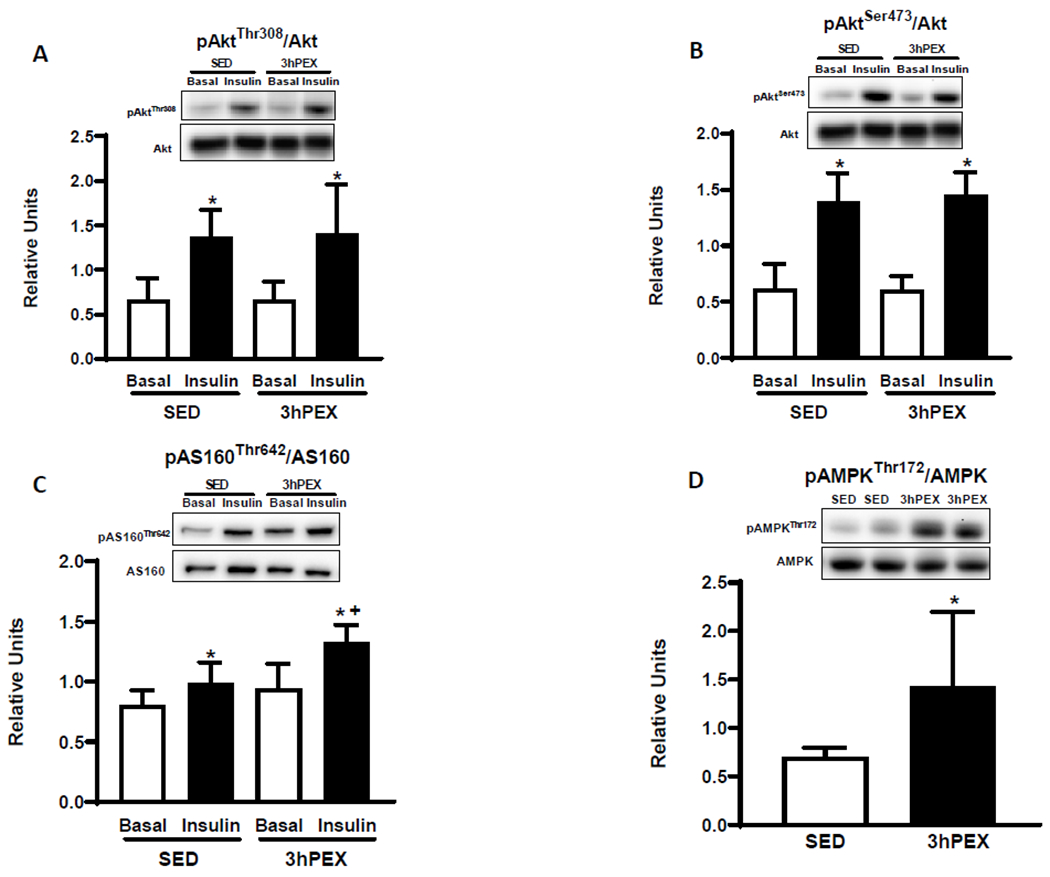
Figure 3.

A: pAktThr308/Akt, B: pAktSer473/Akt, C: pAS160Thr642/AS160 in paired muscles incubated±insulin (100μU/ml). *Insulin versus Basal in both the SED and the 3hPEX groups (P<0.01 for pAktThr308/Akt, P<0.001 for pAktSer473/Akt, P<0.05 for pAS160Thr642/AS160). †P<0.01, 3hPEX versus SED with insulin. Data were analyzed by two-way ANOVA, Values are means ±SD; n=5-6 per group. D: pAMPKThr172/AMPK, in muscles. *P<0.05; 3hPEX versus SED. Data were analyzed by Student’s t-test, values are means±SD; n=5-6 per group.
