Figure 3.

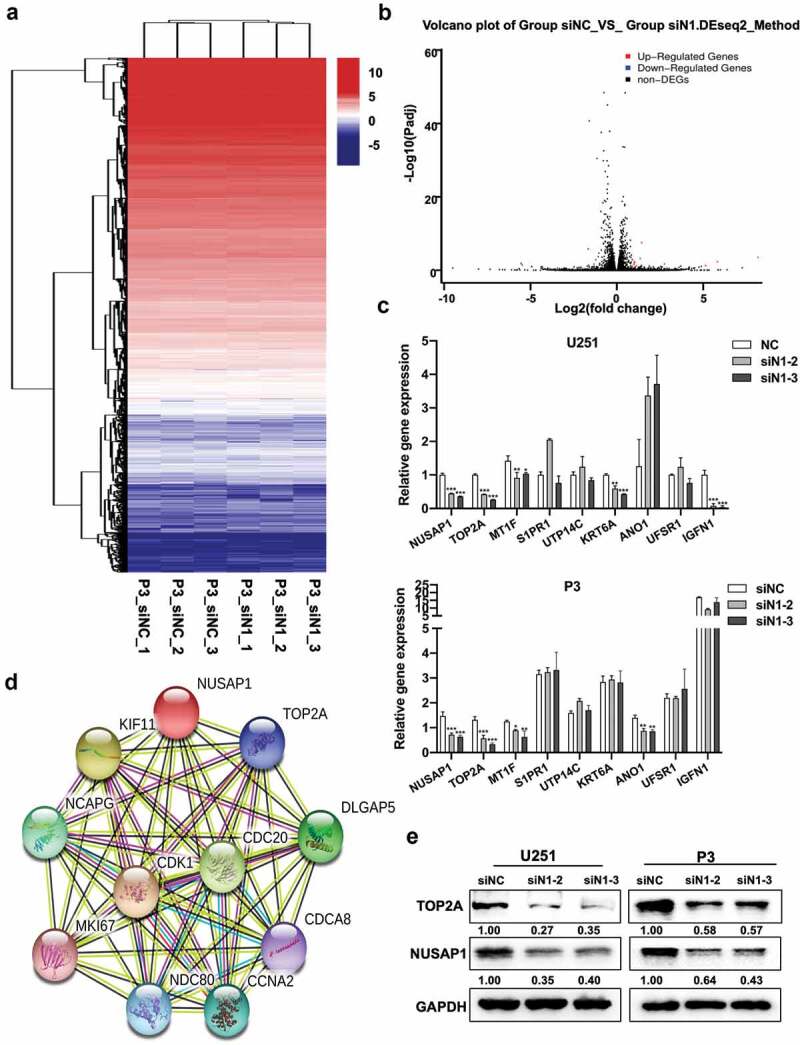
Down-regulation of NUSAP1 inhibits mRNA and protein expression levels of TOP2A in GBM cells. A. Hierarchical clustering based on the differentially expressed genes obtained through RNA sequencing of P3 siNC and P3 siN1 cells. B. Significantly up- or down-regulated genes identified through analysis of RNA sequencing data obtained from stable knockdown of NUSAP1 in P3 cells. C. Results of quantitative RT-PCR with different primers. Data are shown as the mean ± SD. *P < 0.05, **P < 0.01 and ***P < 0.001. D. STRING, is a bioinformatics tool developed to aid in the prediction of protein association networks. E. Western blot analysis of NUSAP1 and TOP2A levels in U251 and P3 cell lines transfected with NUSAP1 siRNAs.
