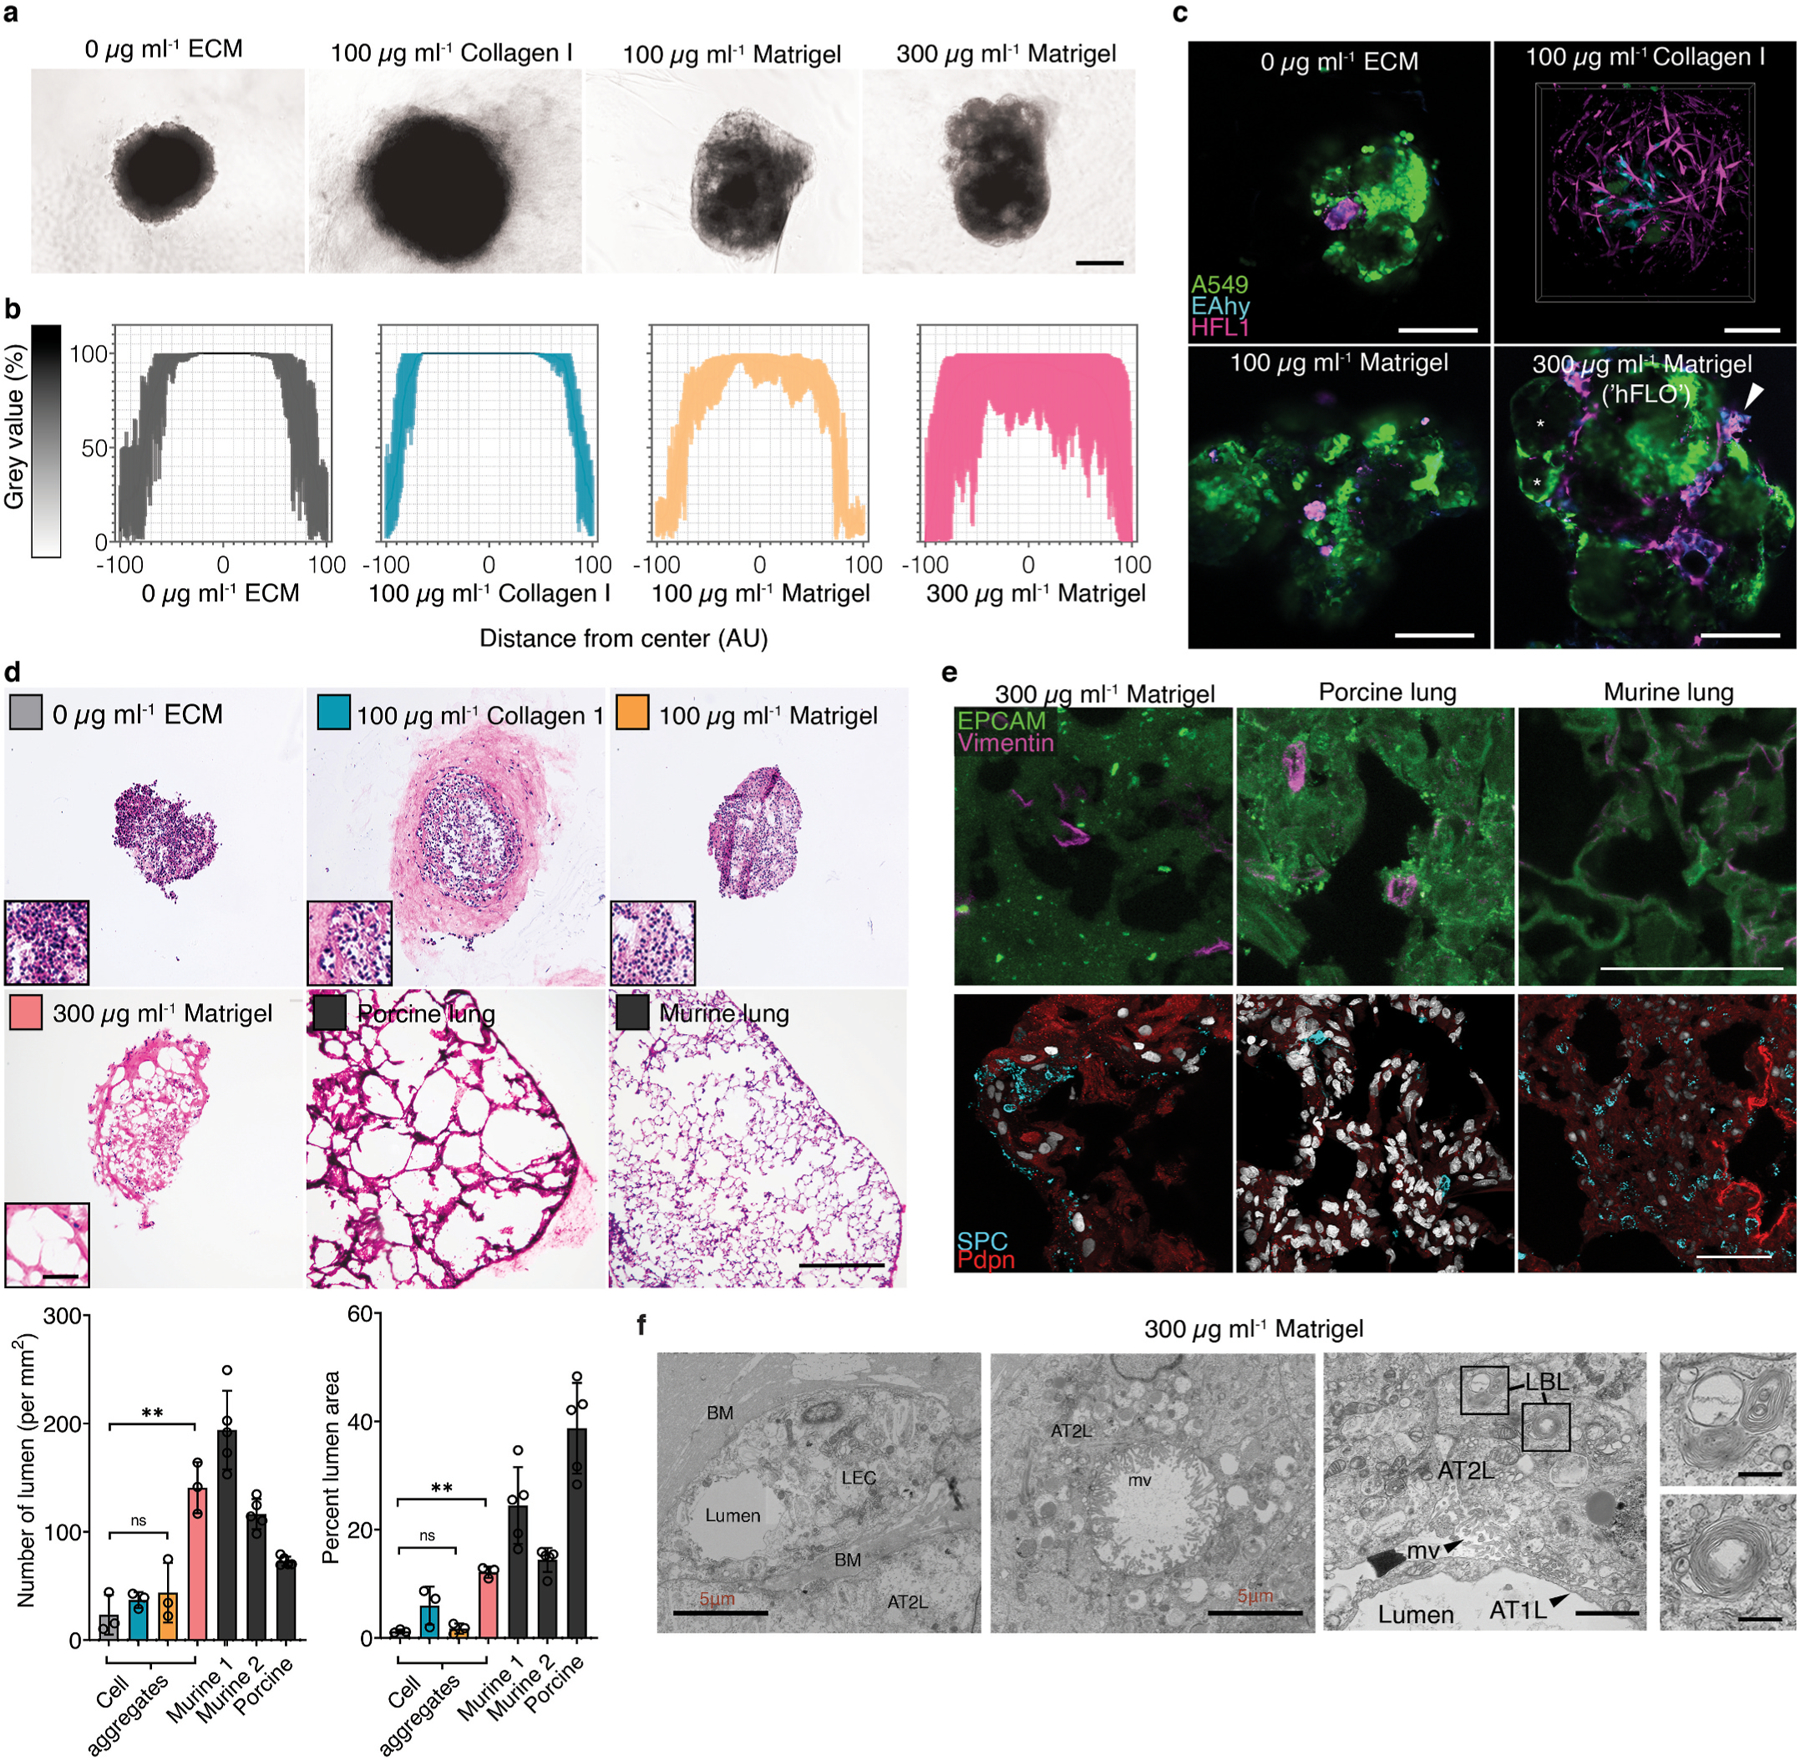
Fig. 1.

Alveolar-like lumen structure formation. a, Representative bright-field images of 3D cell aggregates after 14 days of culture. Scale bars, 300 μm b, Effect of soluble ECM in aggregate density. Line profile analysis at the major axis of the aggregates expressed as normalized grey value. Lines indicate the grey value range at the specific normalized distance from the center. c, Live 3D fluorescence confocal image (single z-section) showing the self-organized localization of the three cell lines—A549 (green), EAHy (blue), and HFL1 (magenta). In aggregates grown using 300 μg mL−1 Matrigel, organotypic structures such as the lumina (*) and endothelial networks (arrow) are indicated. Scale bars, 200 μm d, Hematoxylin and Eosin staining of the aggregates showing that the lumen formation in 300 μg mL−1 Matrigel aggregates is comparable to the mammalian lung parenchyma. Scale bars, 300 μm for full image; 50 μm for inset. Lumen formation is quantified using number of lumen normalized to aggregate size and percent lumen area. Bar colors are indicated in the micrographs above. Mean, individual measurements, and standard deviation are shown. Three independent cell aggregates and lungs from two mice and one pig were used. **P < 0.01, ns (P > 0.05) determined by One-way ANOVA with Welch’s correction. e, Fluorescence confocal images (maximum projection) showing localization of epithelial cells (EPCAM, green) and mesenchymal cells (Vimentin, magenta) relative to the lumen. Specific alveolar epithelial subtypes: Type I (Podoplanin, red) and Type II (prosurfactant protein C, blue). Scale bars, 50 μm f, Transmission electron microscopy of cell aggregates showing stratification and lumen formation in 300 μg mL−1 Matrigel aggregates. Alveolar type II-like epithelial cells (AT2L) shown with their lamellar body-like inclusions (LBL) and microvilli (mv). Other features include: thin, alveolar type I-like cells (AT1L), a luminal structure, presence of a basement membrane (BM), and luminal endothelial cells (LEC). Scale bars, 3 μm for full images; 500 nm for zoomed images. (For interpretation of the references to color in this figure legend, the reader is referred to the Web version of this article.)
