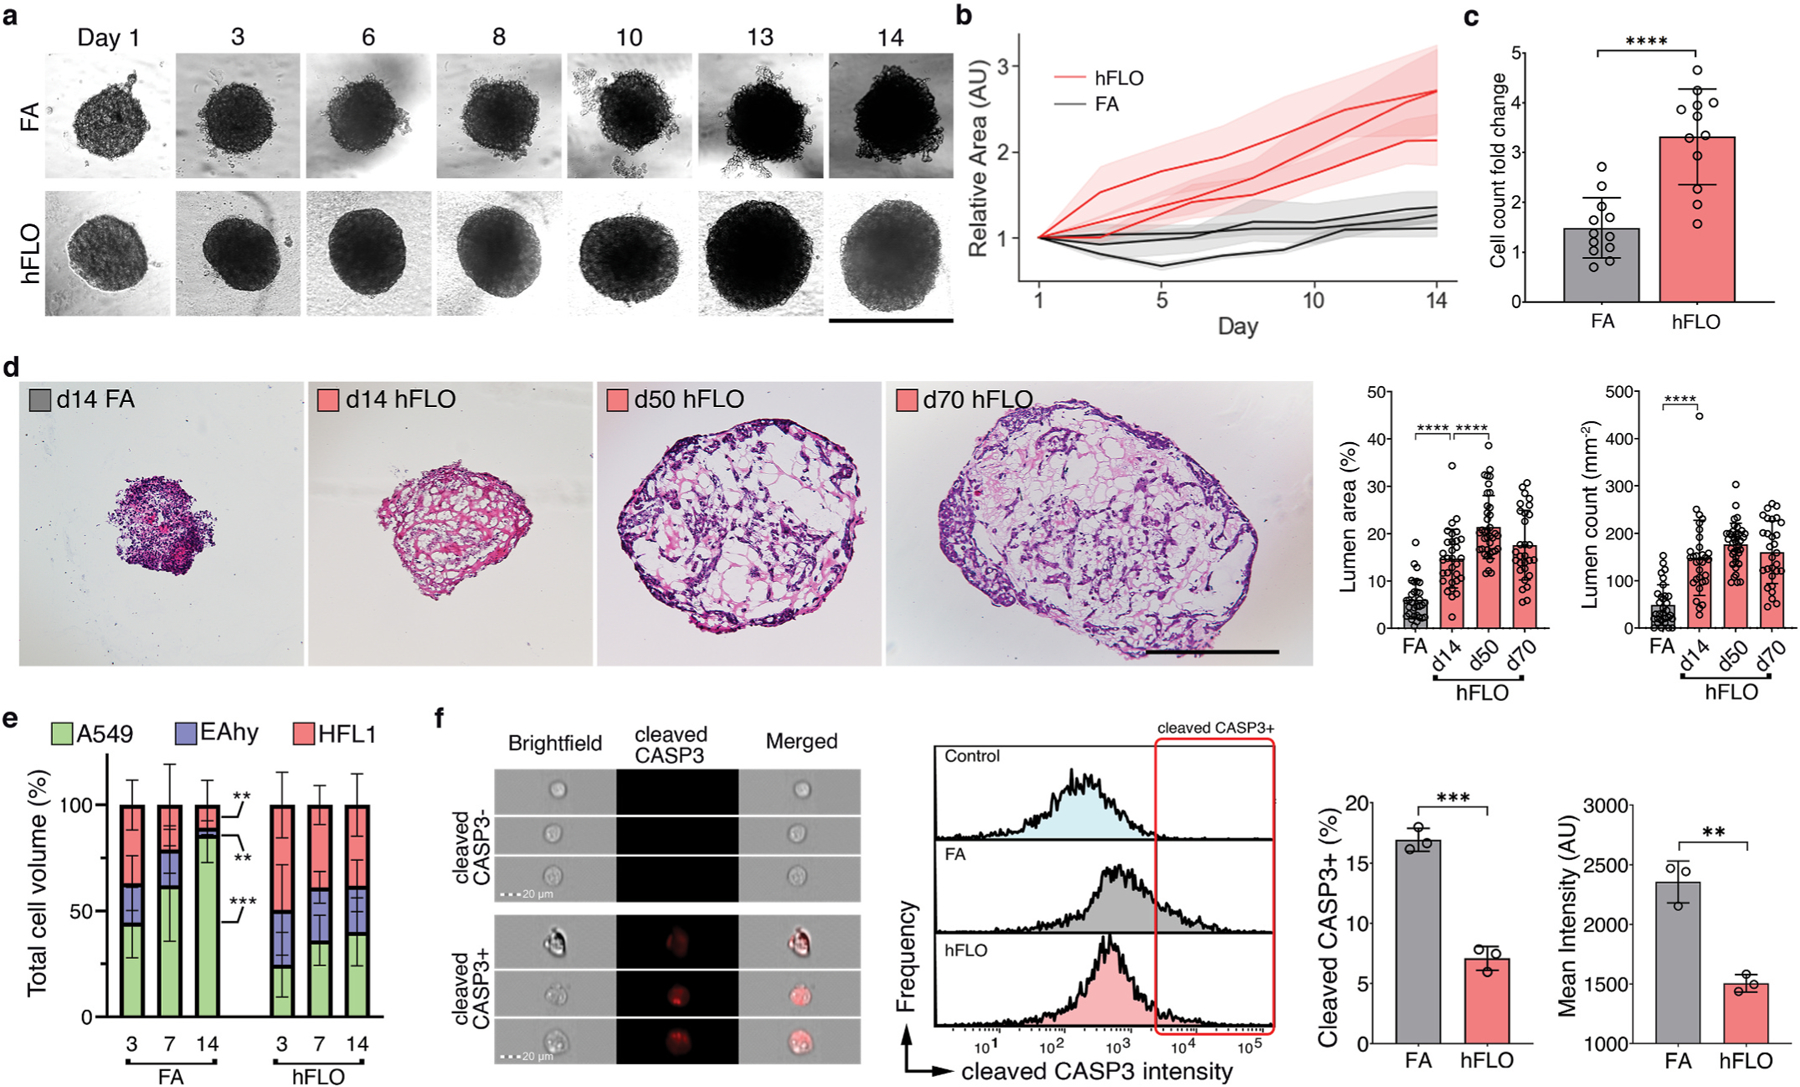
Fig. 2.

3D aggregate growth and cell survival. a, Bright-field images of 3D cell aggregates during the 14-day culture. Scale bar, 300 μm b, Line graph showing change in aggregate area. Areas were normalized to their respective day 1 area. Means and standard deviation are shown. Individual line indicates independent experiments performed by independent researchers. N = 10 independently sampled aggregates on each measured day. c, Cell counts at day 14-fold change from day 0 seeding density. Means, individual values, and standard deviation are shown. 3 independent experiments were performed with >3 cell aggregates used; N = 12 aggregates. ****P < 0.0001 determined by two-tailed t-test with Welch’s correction. d, Hematoxylin and Eosin staining of cell aggregates showing stability of lumen structure in hFLO (up to 70 days of culture) as quantified using lumen area and count. Mean, individual values, and standard deviation are shown. ****P < 0.0001 determined using two-tailed t-test with Welch’s correction using values from n = 27 independent aggregates. e, Cell population composition at days 3, 7, and 14 of culture; n = 7 independently sampled aggregates. **P < 0.01, ***P < 0.001 determined using One-way ANOVA with Welch’s correction comparing day 14 to day 3 values. f, Expression of cleaved caspase 3 of day 14 cell aggregates using imaging flow cytometry. Three independent plates (around 200 cell aggregates) were used and an unstained control from pooled samples was used as a negative gating control. Left bar plot shows percent positive cells with mean, individual points, and standard deviation indicated. Right bar plot shows mean intensities found in each of the samples. ***P < 0.001 determined using two-tailed t-test with Welch’s correction.
