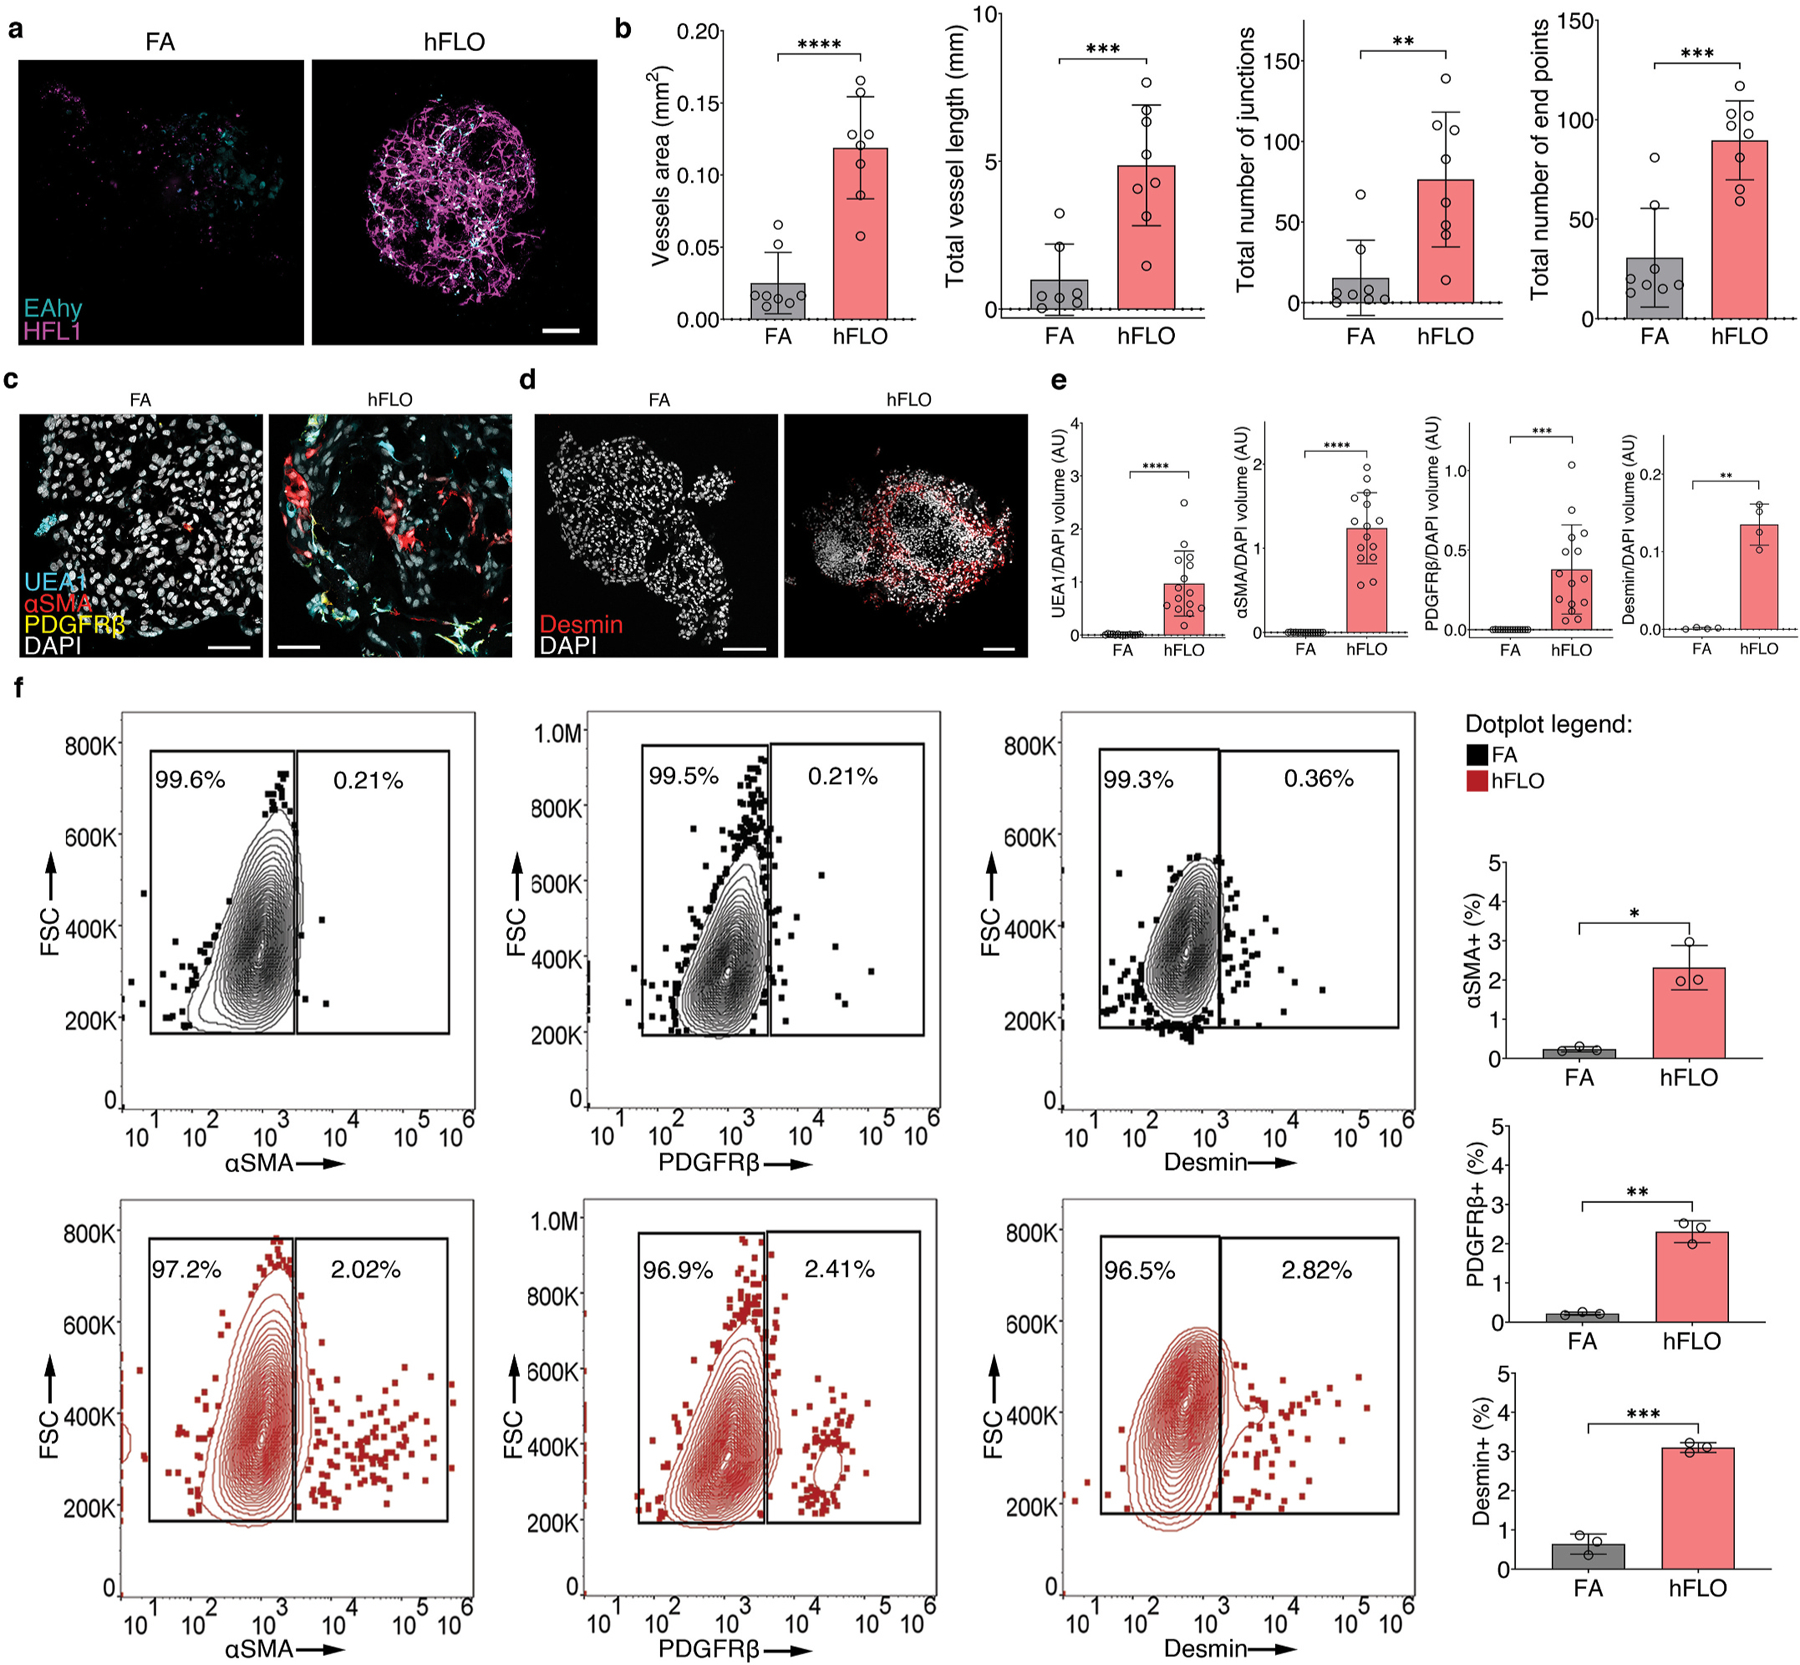
Fig. 3.

Vascular endothelial branching. a, Live fluorescence confocal images (maximum projection) of day 14 cell aggregates showing EAHy (endothelial, blue) and HFL1 (magenta). Scale bars, 100 μm b, AngioTool outputs characterizing the abundance and branching of the EAhy-HFL1 networks. We used 8 independent aggregates per condition. **P < 0.01, ***P < 0.001, ****P < 0.0001 determined using two-tailed t-test with Welch’s correction. c, Fluorescence confocal images (maximum projections) of day 14 hFLO showing the presence of vascular cells including endothelial-like (UEA1 lectin), smooth muscle-like (αSMA), and pericyte-like (PDGFRβ) cells.d, Another perivascular marker, desmin was detected in day 14 hFLO. DAPI was used as the nuclear stain. Scale bars, 100 μm e, Volumetric analyses of UEA1, αSMA, PDGFRβ, and desmin in FA and hFLO aggregates normalized to DAPI volume. We used n = 15 independent cell aggregates for UEA1, αSMA, and PDGFRβ, and n = 4 independent cell aggregates for desmin. **P < 0.01, ***P < 0.001, ****P < 0.0001 determined using two-tailed t-test with Welch’s correction. f, Flow cytometric analysis of whole cell aggregates for expression of αSMA, PDGFRβ, and desmin in FA and hFLO. Contour plots show percent gated cells, contours, and outliers were indicated as dots. Three independent plates were used for each. Bar plots show means, individual points, and standard deviation from positive gates. *P < 0.05, **P < 0.01, ***P < 0.001 determined using two-tailed t-test with Welch’s correction. (For interpretation of the references to color in this figure legend, the reader is referred to the Web version of this article.)
