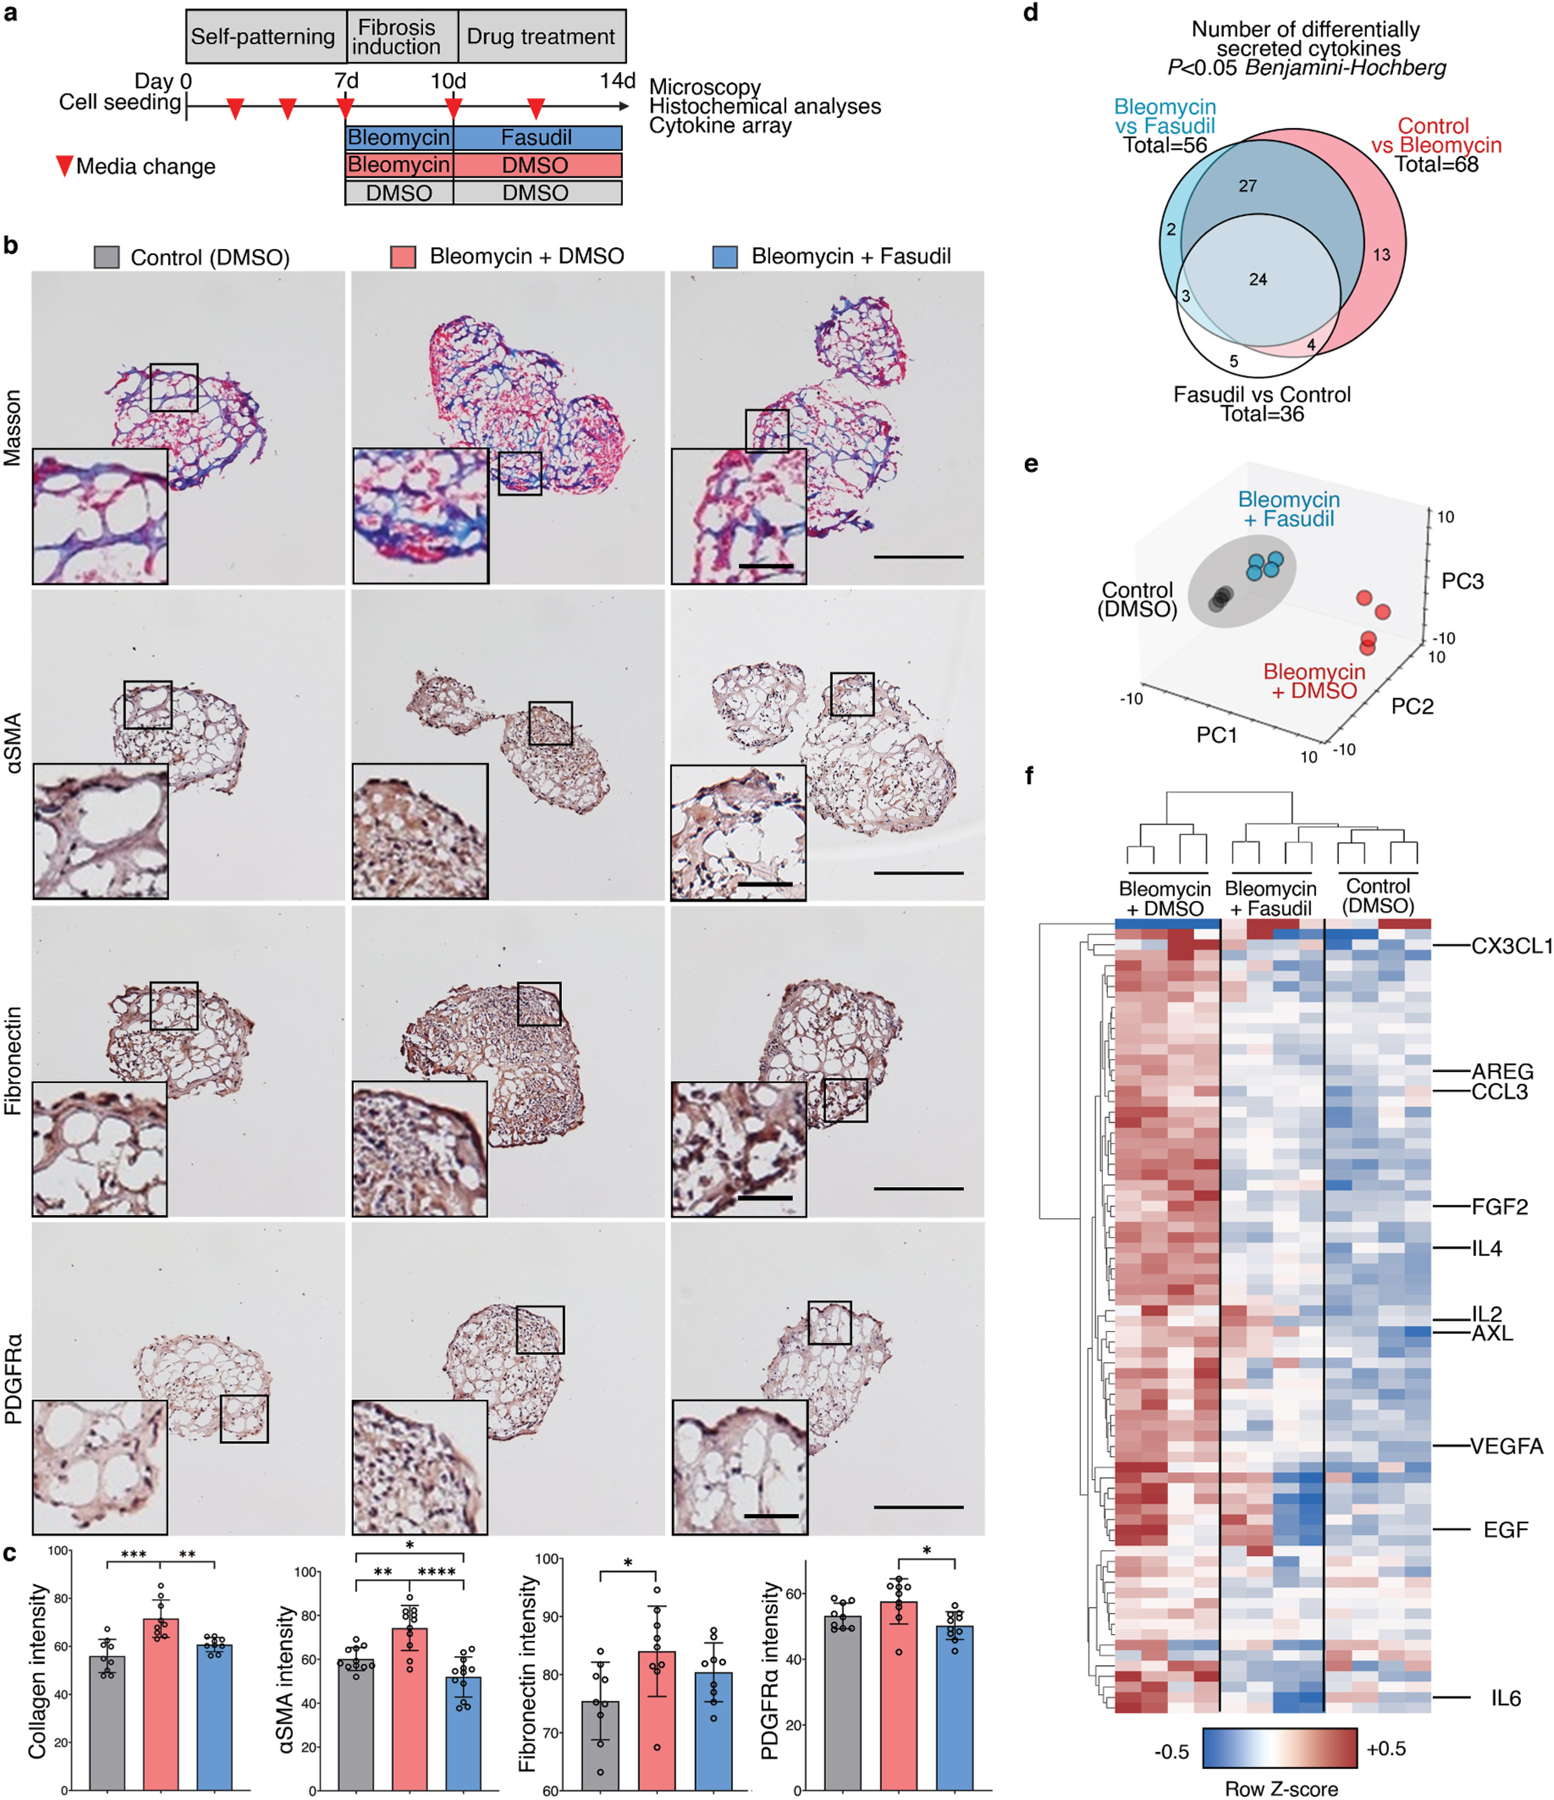
Fig. 5.

Pre-clinical hFLO-bleomycin fibrotic model and resolution of fibrotic features using fasudil. a, Schematic diagram of the workflow showing aggregate formation and self-patterning for 7 days, induction of fibrosis using bleomycin (20 μg mL−1) for 3 days, and antifibrotic trial using fasudil (10 μM). Dimethyl sulfoxide (DMSO) is the vehicle used for the bleomycin and fasudil. b, Histochemical and immunohistochemical analyses for the extent of induced fibrosis in the hFLO aggregates. Insets show fibroblastic foci for bleomycin-treated aggregates. Scale bars, 300 μm for full image; 60 μm for inset. Masson staining shows the extent of collagen deposition (blue). We used 9 independent aggregates per condition. Hematoxylin and DAB immunostaining (H-DAB) of pro-fibrotic markers αSMA, fibronectin, and PDGFRα, respectively. We used n = 11, n = 9, and n = 9 independent aggregates per condition for H-DAB probing for αSMA, fibronectin, and PDGFRα, respectively. c, Histochemical and immunohistochemical image analyses. Bar graphs show means, individual values, and standard deviations are shown. *P < 0.05, **P < 0.01, ***P < 0.001, ****P < 0.0001 determined using One-way ANOVA with Welch’s correction. Color legends shown in b. d-f, Cytokine array profiling the secreted factors from the treatment groups. Raw immunoblot intensity were normalized to internal positive and negative controls. d, Differentially secreted factors (P < 0.05) were determined using two-tailed Welch’s t-test with Benjamini-Hochberg FDR correction. Statistical tests were done comparing each group to each other. Venn diagram shows overlap among differentially secreted factors. e, Principal component analysis of the differentially secreted factors. Dots show media samples collected from the organoids and axes represent principal components (PC) 1, 2, and 3. Clustering among fasudil-treated and control samples is emphasized by the grey ellipse. f, Cluster heatmap (Euclidean) of the differentially secreted factors showing clustering of fasudil-treated and control samples, separate from bleomycin-treated samples. Known cytokine/chemokine effectors of angiogenesis and fibrosis are annotated. Cell color is based on row average-normalized z-scores. (For interpretation of the references to color in this figure legend, the reader is referred to the Web version of this article.)
