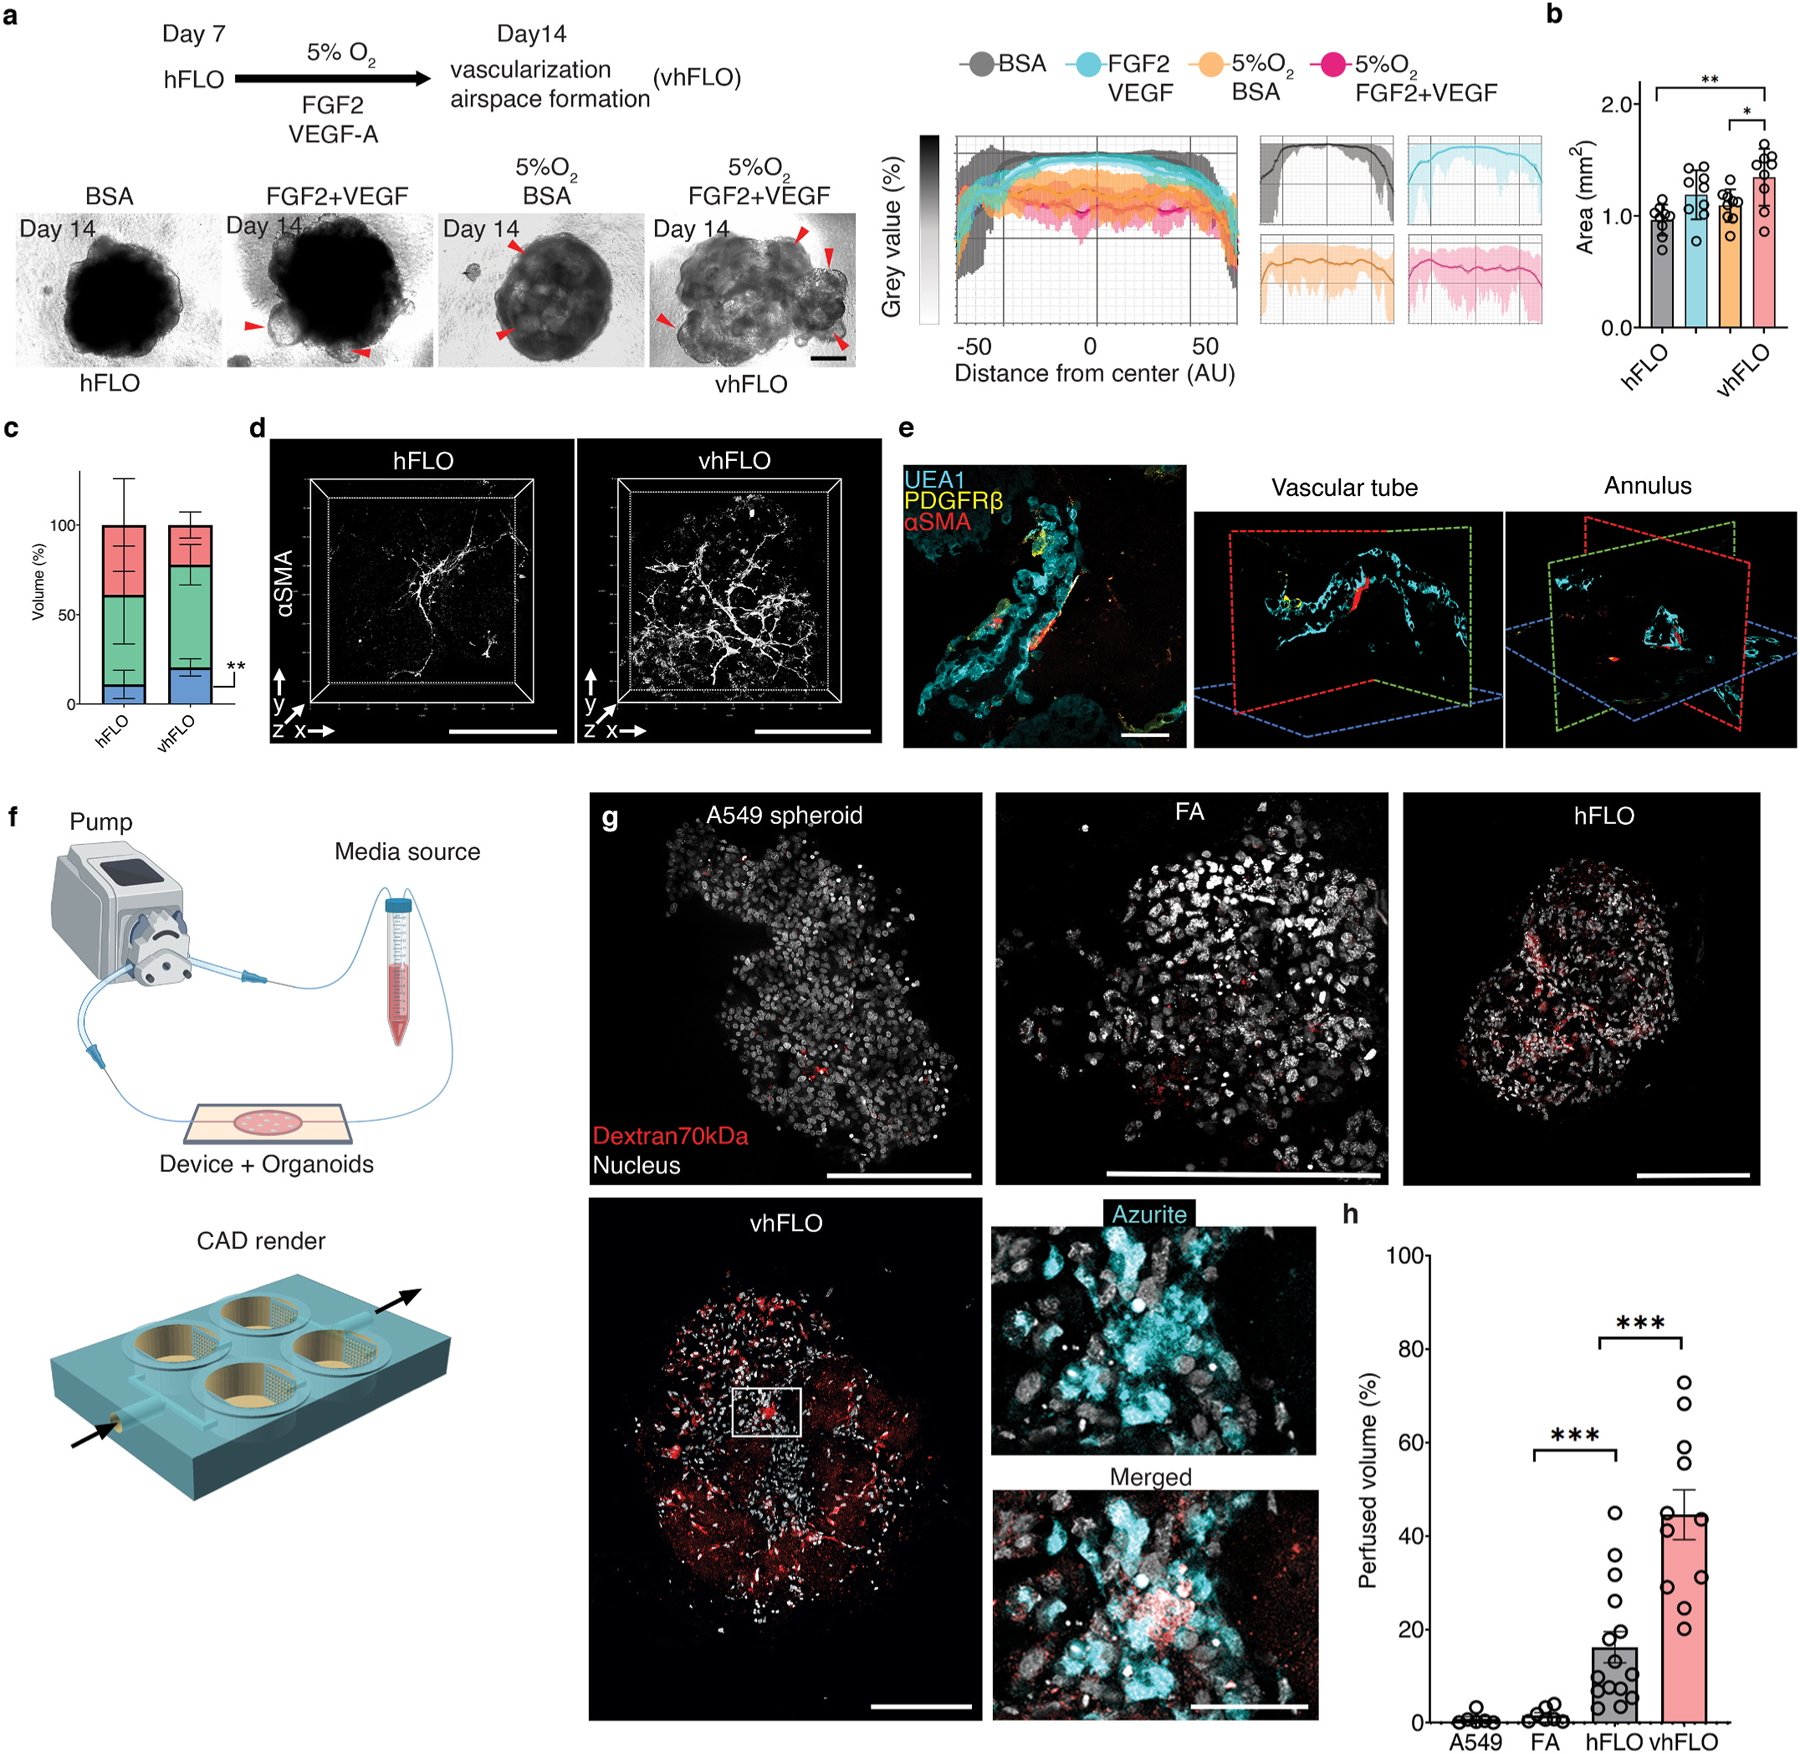
Fig. 6.

Hypoxic vascularization using hFLO. a, Schematic diagram of the workflow showing further vascular growth using hypoxia and pro-angiogenic factors (top left). Bright-field images of aggregates at day 14 of culture (bottom left). vhFLO is hFLO grown under hypoxia for 7 days with supplementation of FGF2 and VEGF. Line profile analysis at the major axis of the aggregates expressed as normalized grey value. Effects of the hypoxic culture in aggregate density is shown using line profile analysis (right). Lines indicate the grey value range at the specific normalized distance from the center. Scale bar, 300 μm b, Aggregate area at day 14 of culture. 9 independent aggregates were measured for each condition. *P < 0.05, **P < 0.01 determined using One-way ANOVA with Welch’s t-test. c, HFL1 (red), A549 (green), and EAhy (blue) cell population percent volume composition in hFLO and vhFLO. N = 7 independent 3D live confocal images were used. **P < 0.01 determined using two-tailed t-test with Welch’s correction. d, Whole aggregate immunostaining of αSMA expression. Scale bar, 200 μm e, 3D fluorescence confocal image of vhFLO showing vascular-like formation and localization of endothelial-like (UEA1 lectin+, BLUE), pericyte-like (PDGFRβ+, yellow), and smooth muscle-like (αSMA+, red). 3D renderings highlight annular tube morphology typical of a vasculature. Scale bar, 50 μm f, Illustration of the vascular perfusion assay using dextran 70 kDa flown through a peristaltic pump system (top). The chip used for this assay is shown as a CAD render with fluidic flow indicated by arrows. Additional information could be found in Supplementary Fig. 10 g, Whole aggregate fluorescence confocal images (single z section) of A549 spheroid, FA, hFLO and vhFLO. Images show extent of dextran 70 kDa perfusion. Zoomed images showing dextran and azurite colocalization in vhFLO. Scale bars, 200 μm for full images; 50 μm for zoomed images. h, Volumetric analysis of extent of perfusion in the aggregates. A549 spheroid was used as a negative control. We used n = 6 A549 spheroid, n = 7 FA, n = 15 hFLO, and n = 11 vhFLO independent aggregates. ***p < 0.001 determined using One-way ANOVA with Welch’s t-test. (For interpretation of the references to color in this figure legend, the reader is referred to the Web version of this article.)
