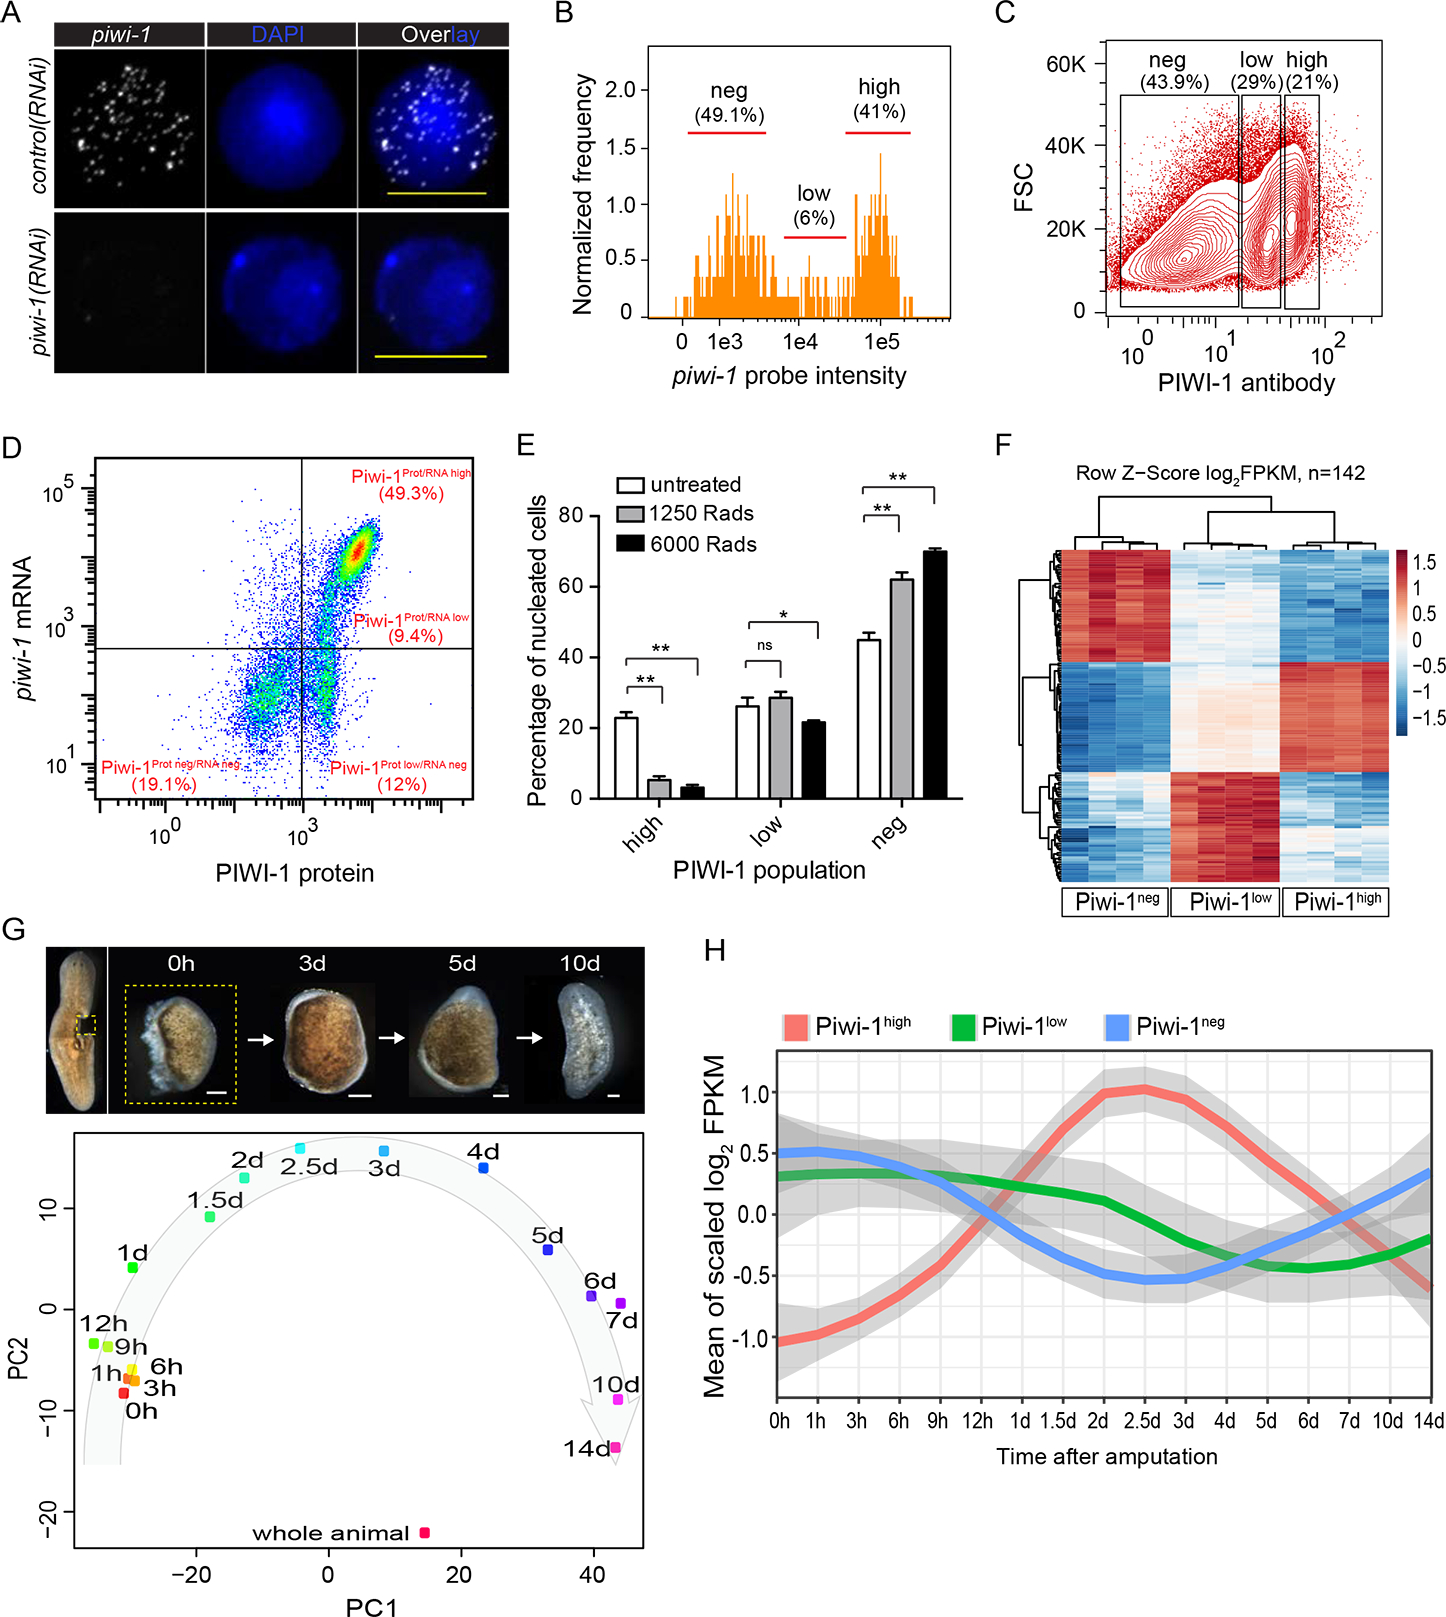
Figure 1. Piwi-1 mRNA and protein measurements in neoblast populations.

(A) Super resolution images of FISH staining of piwi-1 transcripts on single X1 cells from control or piwi-1(RNAi) animals. Representative cells shown. n>10 for each condition. Scale bar, 10 μm.
(B) piwi-1 transcript distribution by ImageStream flow cytometric analysis. piwi-1 high cells, high; piwi-1 low cells, low; piwi-1 negative cells, neg. Positive cell population determined by distribution of negative control probe stained cells shown in S1A. Representative of 3 independent experiments shown.
(C) PIWI-1 antibody intracellular staining followed by flow cytometric analyses. PIWI-1 high cells, high; PIWI-1 low cells, low; PIWI-1 negative cells, neg. Representative of more than 3 independent experiments shown.
(D) Representative FACS plot and frequency of pre-sorted cells after co-staining with piwi-1 probe and PIWI-1 antibody. Positive cell population determined by distribution of negative control probe or isotype antibody stained cells shown in S1F. Representative of 3 independent experiments shown.
(E) Comparison of PIWI-1 signal levels in cells from planarian 1-day after treatment with different irradiation dosages. Each column represents percent of indicated cells on total nucleated cells. Error bars: SD. **p-value <0.001, *p-value <0.05.
(F) Differential expression heatmap of signature genes for Piwi-1high, Piwi-1low and Piwi-1neg populations. Shown are log2FPKM with row scaled (z-score) based on RNA-seq data of cell populations shown in (C). Shown are 142 genes enriched for each cell population (Table S1).
(G) Principal component analysis (PCA) of all regeneration time points profiled. Data were from time-course of small tissue fragments undergoing a full cycle of whole-body regeneration. Each dot represents the average of 4 replicates. Scale bar, 100 μm. (H) Dynamic changes of signature genes specifically expressed in each of the three PIWI-1 groups (shown in F) over the RNA-seq of whole-body regeneration time courses. See also Figs. S1, S2; Table S1.
