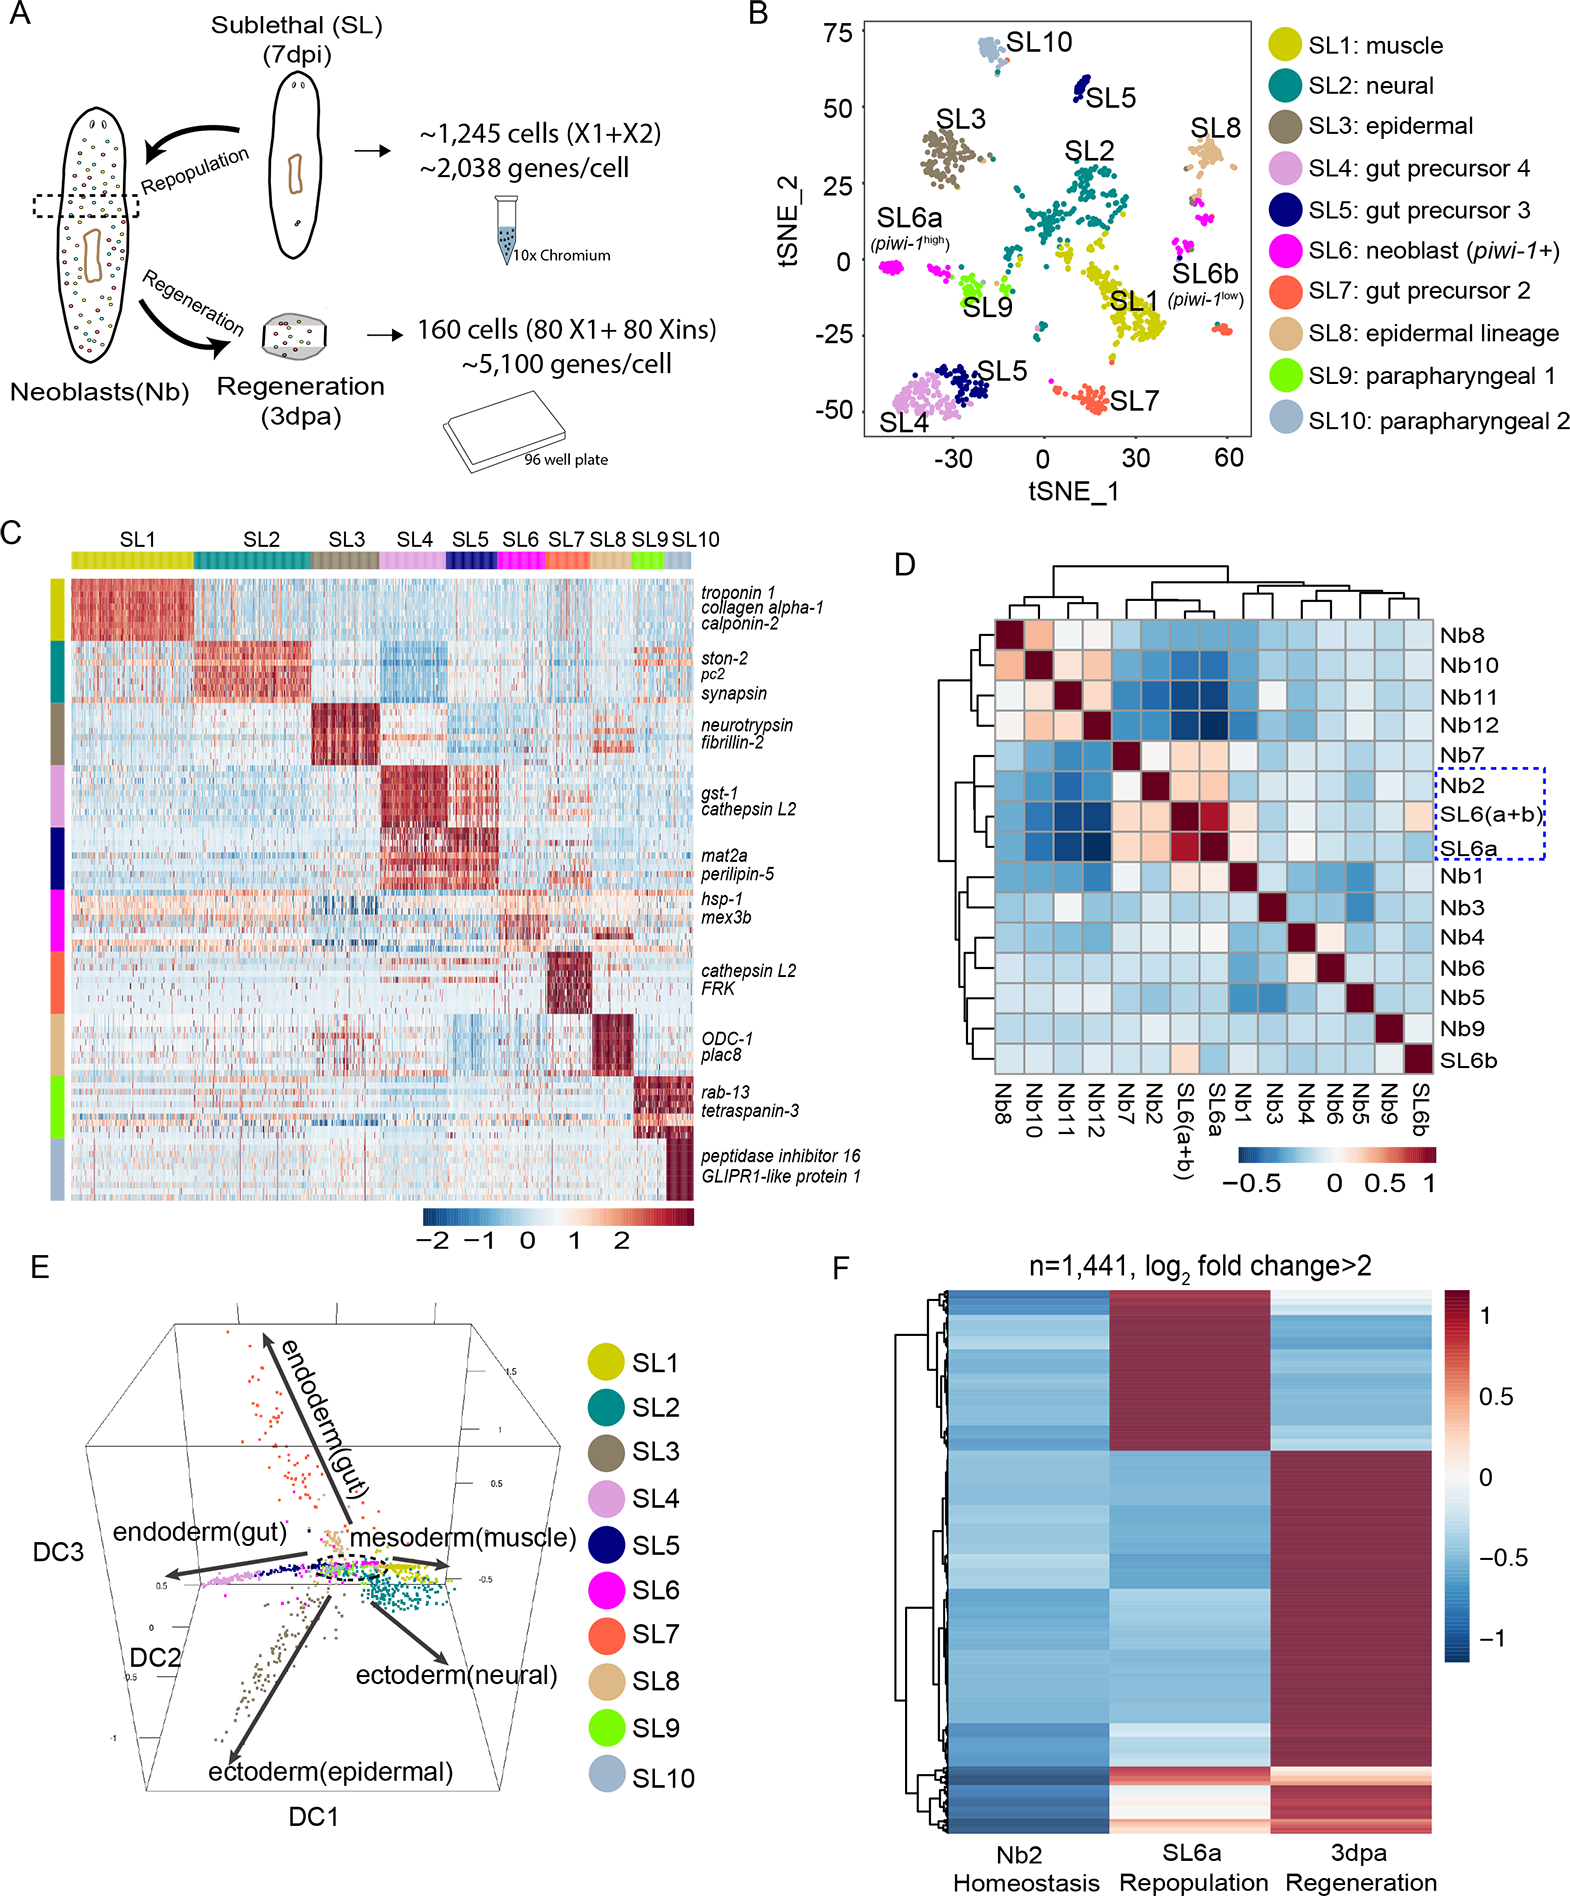
Figure 6. Response of pluripotent stem cells to regeneration and repopulation signals.

(A) Comparison strategy of single-cell transcriptomic data from homeostatic, repopulation and regeneration conditions. Droplet-based 3’ or plate-based full-length scRNA-seq were used.
(B) t-SNE plot of surviving X1 and X2 cells (n=1,039 after QC filter) after sub-lethal irradiation. Colors indicate unbiased cell classification via graph-based clustering. Sub-Lethal irradiated cell groups, SL.
(C) Scaled expression heatmap of discriminative gene sets for each cluster defined in (B) Color scheme based on z-score distribution from −2.5 (Blue) to 2.5 (Red). Left margin color bars highlight gene sets (right side) specific to respective cell subsets.
(D) Spearman rank correlation heatmap for all pairwise comparisons of indicated cell types. Spearman correlations were calculated using normalized read counts across the entire transcriptome (n=31,253 genes) for all RNA-seq experiments.
(E) Neoblast and progenitor cell cluster visualization using diffusion map. Five main branches are indicated with solid arrows, with one cluster (SL6) sitting at the root (dashed lines).
(F) Scaled expression heatmap of discriminative gene sets upregulated (Log2 fold change > 2) in regeneration (3dpa, tspan-1+ cells), repopulation (7dpi, SL6a cells) or both when compared to homeostatic Nb2 group.
