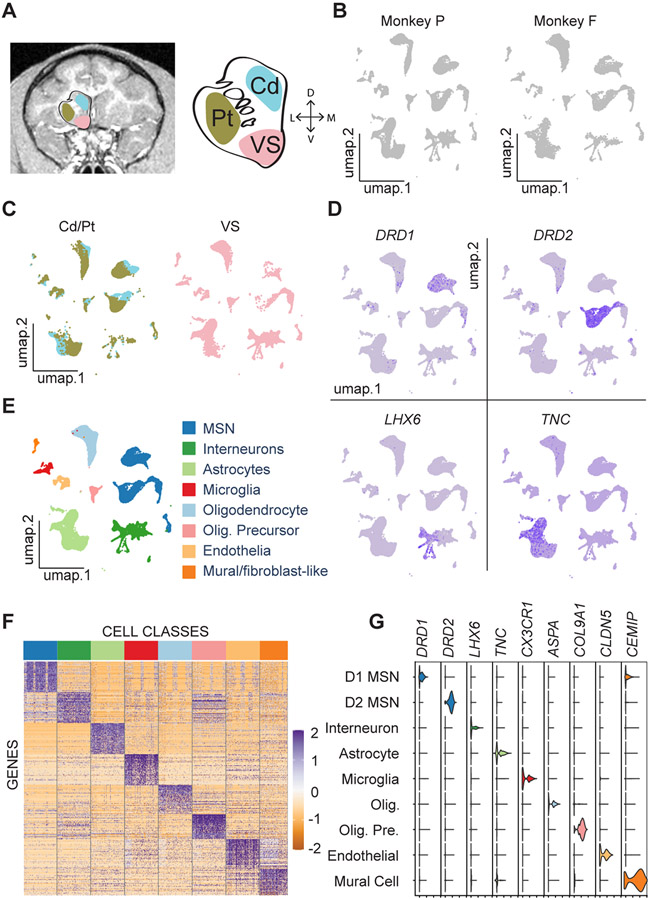
Figure 1. Cell Type Taxonomy in the Primate Striatum.
(A) MRI image of a Rhesus macaque coronal brain section (left) showing three striatal regions labeled with cyan (caudate nucleus), brown (putamen), and pink (ventral striatum). Schematic striatum (middle) marked by Cd (caudate nucleus), Pt (putamen), and VS (ventral striatum). The right axis shows dorsal (D), ventral (V), lateral (L), and medial (M) directions.
(B) UMAP visualizations of the samples from two subjects (P and F).
(C) UMAP visualizations of striatal nuclei colored by the three regions. The color scheme for these regions is the same as in A.
(D) Feature plots of canonical neuronal and astrocyte marker gene expression in striatal nuclei.
(E) UMAP visualization colored according to eight major classes in the NHP.
(F) Heat map of differentially expressed genes. Color bar at the top corresponds to the major classes identified in E.
(G) Violin plots of distributions of marker gene expression across nine clusters, with MSNs divided into D1- and D2-MSNs.
See also Figures S1 and S2, Table S1, and Data S1.

