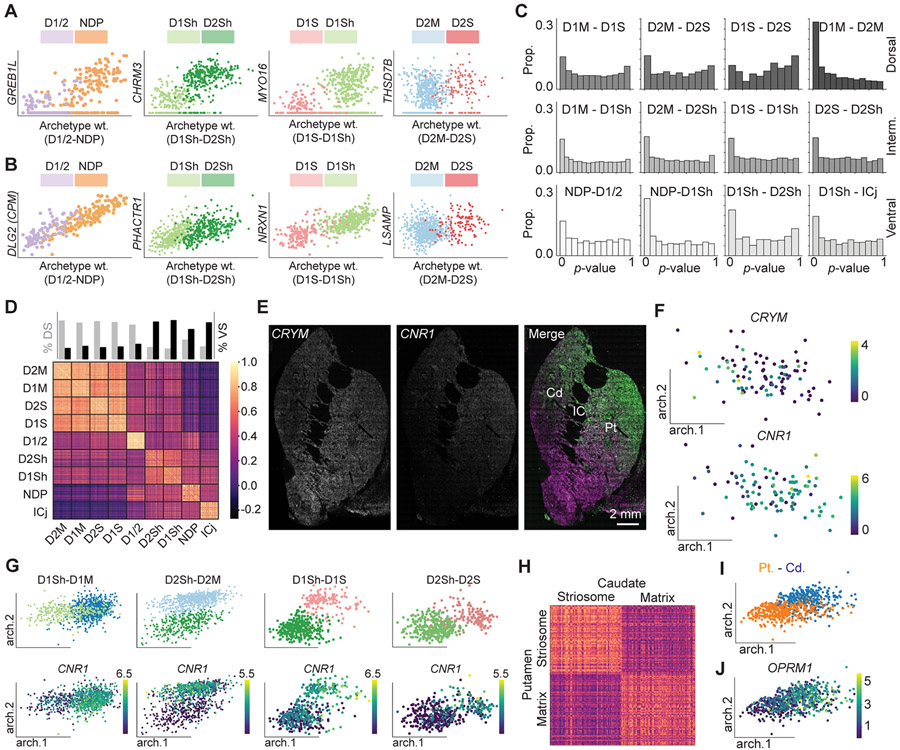
Figure 3. Archetypal Analysis of MSN Subtypes.
(A) Representative genes showing significant discontinuity between a subtype pair.
(B) Representative genes showing non-significant discontinuity between a subtype pair.
(C) The p-value distributions between each subtype pair.
(D) Heat map showing the cosine similarity between cells within and between the nine types of MSNs.
(E) FISH labeling of CRYM (magenta) and CNR1 (green) reveals a continuous gradient on the dorsal-ventral axis.
(F) CRYM (top) and CNR1 (bottom) expressions along the D1/D2-hybrid archetype axes.
(G) The archetype distribution of subtype pairs (top) that were divided between the dorsal and ventral striatum and CNR1 (bottom) distributions in these archetype axes.
(H) Heat map showing the cosine similarity between cells within and between striosome and matrix in caudate and putamen. The color scale is the same as in D.
(I) Distribution of caudate and putamen in archetype axes.
(J) OPRM1 expression in the caudate and putamen cells along the archetype axes.

