Figure 7.
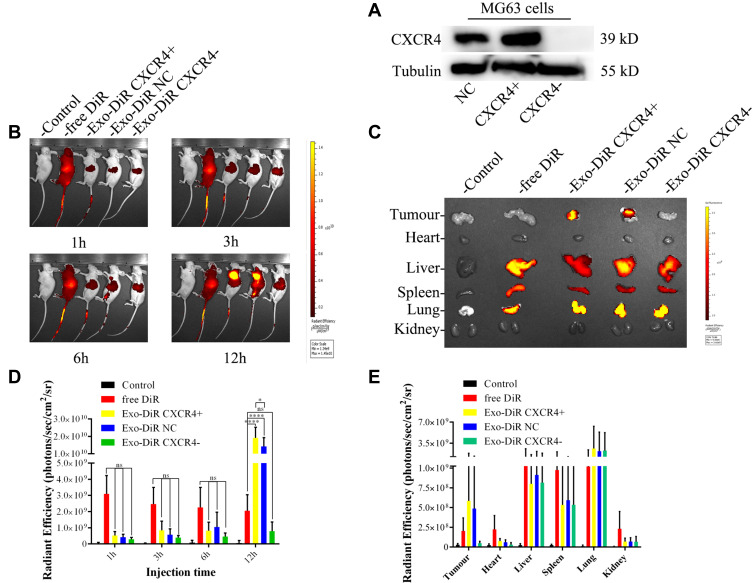
The biodistribution of DiR-labeled exosomes was examined by in vivo imaging of DiR fluorescence. (A) the expression of CXCR4 protein in MG63 cells after the knockout or overexpression of CXCR4 gene. (B) Nude mice bearing subcutaneous MG63, MG63 CXCR4+ and MG63 CXCR4- xenografts©received intravenous injection of saline, free DiR or Exo-DiR (50 μg/kg DiR) and were scanned at different times (1, 3, 6, and 12 h) after injection using an imaging system. (C) Fluorescence imaging of excised organs from tumor-bearing mice 12 h after IV injection with saline, free DiR or Exo-DiR. (D) Graphical representation of the fluorescence intensity of the tumor site at the selected time point in the five groups. (E) Organs were removed and DiR dye signals in each organ were quantified after injection. The scale bar is in arbitrary units and is a colorimetric representation of the minimum and maximum signals; all the depicted images are reconstructed with the same scale. Mean ± SD, n = 5. ns, not significant. *p < 0.05, ****p < 0.0001 when compared with the indicated groups.

