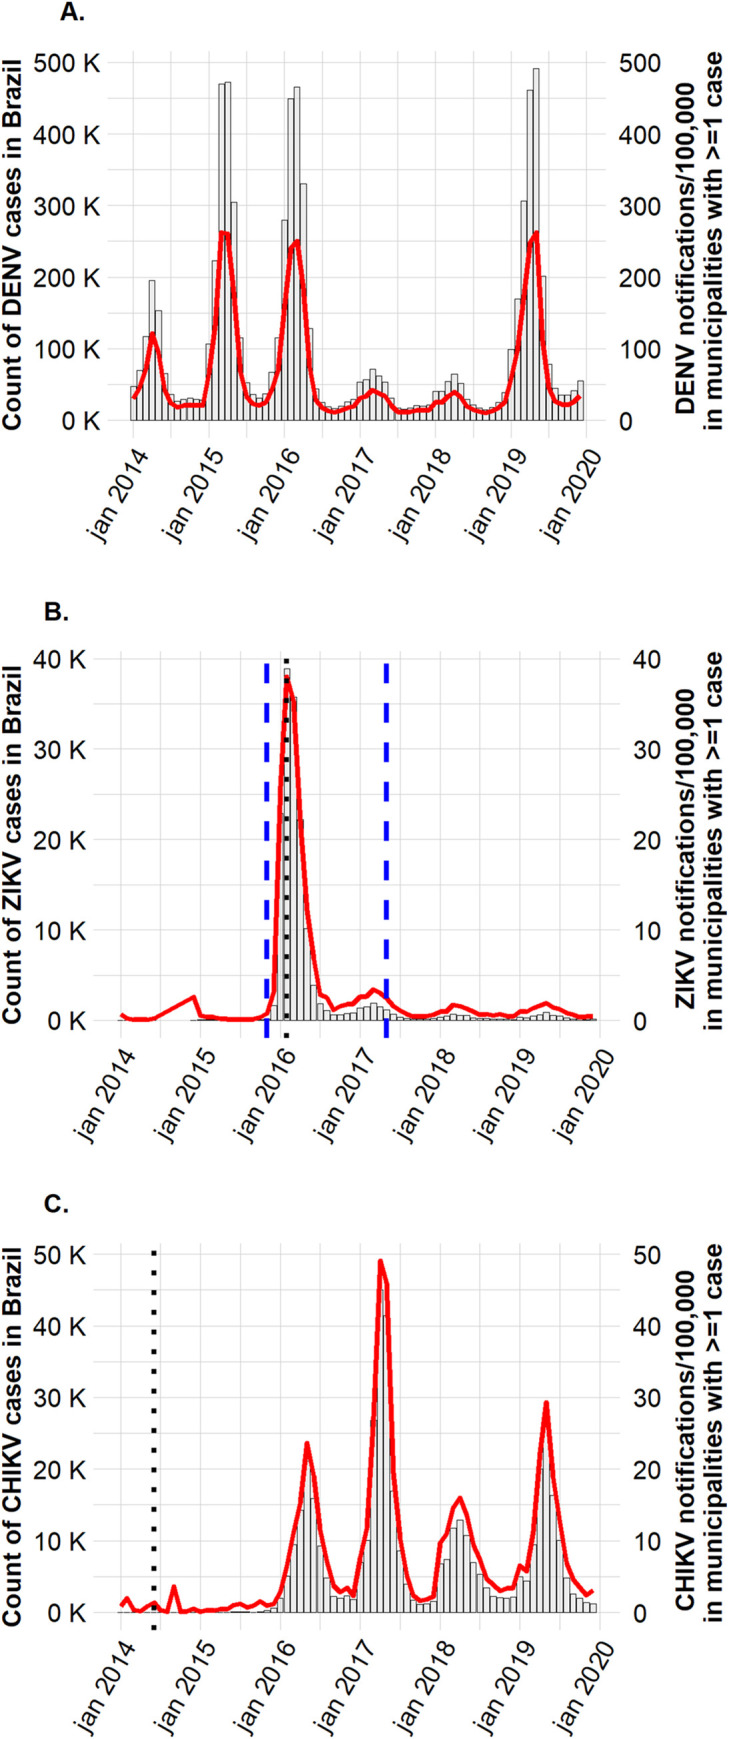
Fig 1.

Number of (A) DENV, (B) ZIKV and (C) CHIKV case notifications (bars, main Y axys) and notifications per 100,000 (red line, secondary Y axys) in Brazilian municipalities with at least one notification between 2014 and 2019. Please note that the scales differ between the three graphs. The dotted black lines in graphs B and C mark the start of ZIKV and CHIKV mandatory notification in Brazil. The dashed blue lines in graph B mark the start and the end of Zika Public Health emergency.
