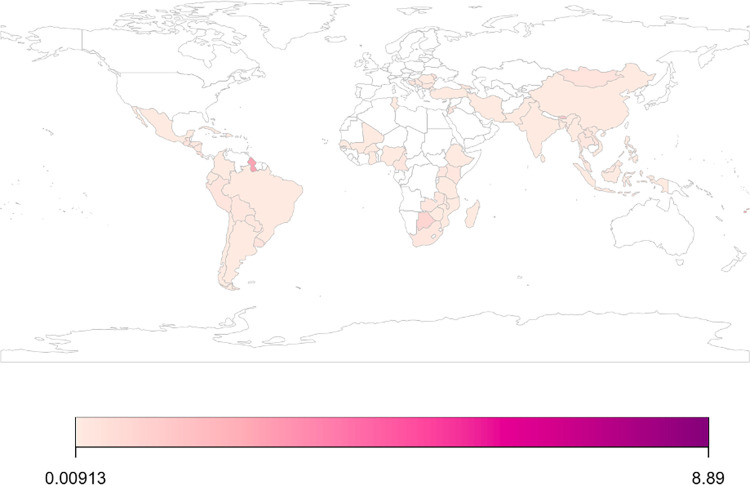
Fig 3. Distribution of studies per 1 million population by country of implementation.
We used country population size in 2020 (https://data.worldbank.org/indicator/SP.POP.TOTL) to standardized estimates expressed as number of studies per 1 million population. We used “rworldmap” package (https://cran.r-project.org/web/packages/rworldmap/rworldmap.pdf) available in R software to present these standardized estimates across countries where interventions were implemented. Country borders in this package are derived from Natural Earth data. Table E in S1 Appendix shows number of included studies per country.

