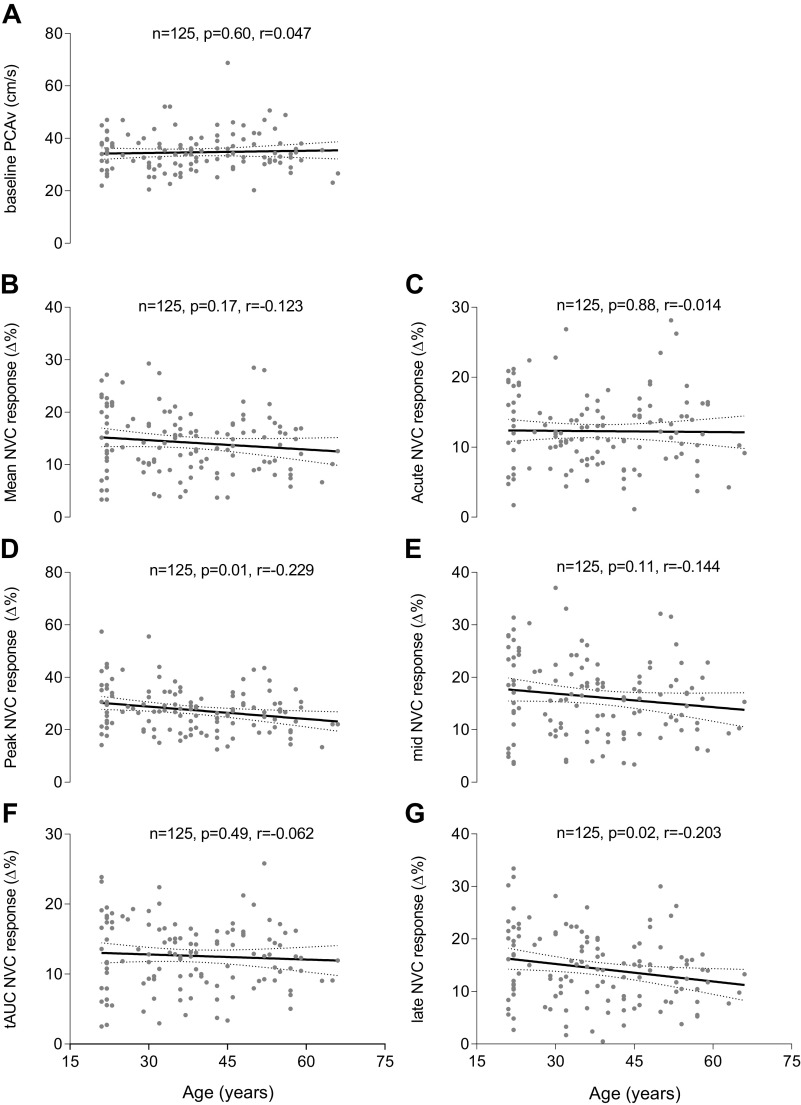
Figure 4.
Simple linear regression analysis demonstrating the relationship between age, cerebral hemodynamics, and NVC metrics. Simple Linear regressions are presented for the relationship between age and baseline PCAv (A), mean NVC response (B), acute NVC response (C), peak NVC response (D), mid NVC response (E), tAUC NVC response (F), and late NVC response (G). NVC metrics are presented as the % change from baseline along the y-axis. These models are unadjusted with respect to sex. Age (years) is presented along the x-axis. Text boxes imposed on each graph include sample size (n), P value, and Pearson’s correlation coefficient (r). NVC, neurovascular coupling; PCAv, posterior cerebral artery velocity; tAUC, total area under the curve.

