. 2021 Dec 13;82(4):695–707. doi: 10.1158/0008-5472.CAN-20-3209

Figure 4.

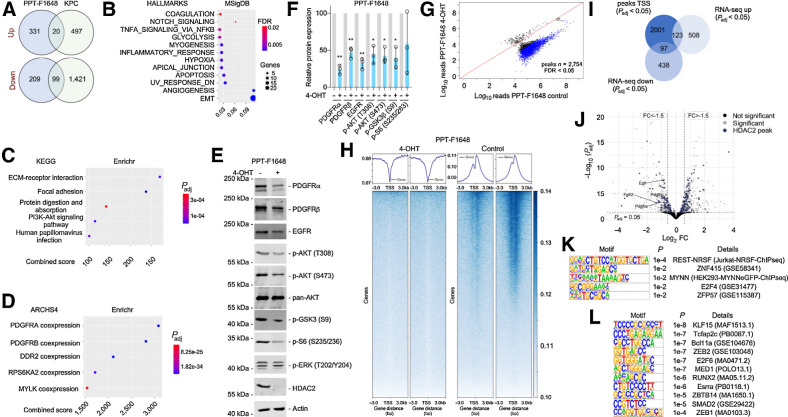
Figure 4. HDAC2 maintains RTK-driven survival signaling. A, HDAC2 regulated genes in microarray of KPC (n = 3) and KPCH2lox/lox (n = 3) cancer cell lines (i) and 4-OHT–treated compared with vehicle-treated PPT-F1648 cells (ii) were analyzed in a Venn diagram including genes regulated with a log FC ± 0.58 and a P < 0.05. B, Genes consistently downregulated in Hdac2 knockout models were analyzed by the MolecularSignatureDatabase (MSigDB). HALLMARK signatures with an FDR < 0.05 are depicted. The FDR is color coded, number of genes contributing are coded by size. The ratio gene number to number of genes in the signature is depicted. C and D, Genes consistently downregulated in Hdac2 knockout models were analyzed by the Enrichr web tool using the libraries Kyoto Encyclopedia of Genes and Genomes (KEGG) 2021 and ARCH4 kinase coexpression. Top five signatures ranked according to the combined score. Padj value is color coded and the combined score is depicted. E, PPT-F1648 cells were treated for eight days with 4-OHT (600 nmol/L) or were left as vehicle treated controls. Western blot of PDGFRα, PDGFRβ, EGFR, phospho-AKT (T308 and S473), pan-AKT, phospho-GSK3 (S9), phospho-S6 (S235/236), phospho-ERK (T202/Y204), and HDAC2. Actin, loading control. One representative Western blot out of three is depicted F, Quantification of three independent experiments according to E. *, P < 0.05; **, P < 0.01 (t test). G, Differential analysis of reads in HDAC2 peaks between Hdac2-proficient and Hdac2-deficient PPT-F1648. Blue, significant peaks (FDR < 0.05, n = 2754). H, Density plot (top) and heatmap (bottom) of HDAC2 ChIP-seq reads around the proximal promoter in Hdac2-proficient and Hdac2-deficient PPT-F1648 (read counts per million). I, Overlap of significant HDAC2 peaks around the TSS (± 3,000 bp; Padj < 0.05) with significant differentially expressed genes in Hdac2-deficient PPT-F1648 cells (Padj < 0.05). J, Volcano plot of differentially regulated genes in Hdac2-deficient PPT-F1648 cells. Blue, genes with HDAC2 ChIP-seq peaks; gray, significant differential genes (Padj < 0.05). K, Homer motif analysis of all significant HDAC2 ChIP-seq peaks in promoter regions (TSS ± 3,000 bp; Padj < 0.05; n = 2,360); known motifs are depicted. L, Homer motif analysis of significant HDAC2 ChIP-seq peaks with downregulation in RNA-seq. De novo motif results are depicted (TSS ± 3,000 bp; Padj < 0.05; n = 102).

HDAC2 maintains RTK-driven survival signaling. A, HDAC2 regulated genes in microarray of KPC (n = 3) and KPCH2lox/lox (n = 3) cancer cell lines (i) and 4-OHT–treated compared with vehicle-treated PPT-F1648 cells (ii) were analyzed in a Venn diagram including genes regulated with a log FC ± 0.58 and a P < 0.05. B, Genes consistently downregulated in Hdac2 knockout models were analyzed by the MolecularSignatureDatabase (MSigDB). HALLMARK signatures with an FDR < 0.05 are depicted. The FDR is color coded, number of genes contributing are coded by size. The ratio gene number to number of genes in the signature is depicted. C and D, Genes consistently downregulated in Hdac2 knockout models were analyzed by the Enrichr web tool using the libraries Kyoto Encyclopedia of Genes and Genomes (KEGG) 2021 and ARCH4 kinase coexpression. Top five signatures ranked according to the combined score. Padj value is color coded and the combined score is depicted. E, PPT-F1648 cells were treated for eight days with 4-OHT (600 nmol/L) or were left as vehicle treated controls. Western blot of PDGFRα, PDGFRβ, EGFR, phospho-AKT (T308 and S473), pan-AKT, phospho-GSK3 (S9), phospho-S6 (S235/236), phospho-ERK (T202/Y204), and HDAC2. Actin, loading control. One representative Western blot out of three is depicted F, Quantification of three independent experiments according to E. *, P < 0.05; **, P < 0.01 (t test). G, Differential analysis of reads in HDAC2 peaks between Hdac2-proficient and Hdac2-deficient PPT-F1648. Blue, significant peaks (FDR < 0.05, n = 2754). H, Density plot (top) and heatmap (bottom) of HDAC2 ChIP-seq reads around the proximal promoter in Hdac2-proficient and Hdac2-deficient PPT-F1648 (read counts per million). I, Overlap of significant HDAC2 peaks around the TSS (± 3,000 bp; Padj < 0.05) with significant differentially expressed genes in Hdac2-deficient PPT-F1648 cells (Padj < 0.05). J, Volcano plot of differentially regulated genes in Hdac2-deficient PPT-F1648 cells. Blue, genes with HDAC2 ChIP-seq peaks; gray, significant differential genes (Padj < 0.05). K, Homer motif analysis of all significant HDAC2 ChIP-seq peaks in promoter regions (TSS ± 3,000 bp; Padj < 0.05; n = 2,360); known motifs are depicted. L, Homer motif analysis of significant HDAC2 ChIP-seq peaks with downregulation in RNA-seq. De novo motif results are depicted (TSS ± 3,000 bp; Padj < 0.05; n = 102).