. 2022 Jan 1;28(11):2339–2348. doi: 10.1158/1078-0432.CCR-21-2572

Figure 1.

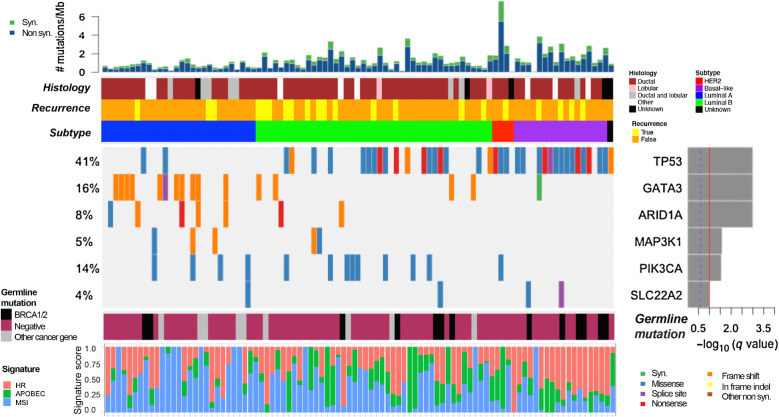
Figure 1. Significant SNVs, short indels, and signature analysis. Comutation plot showing recurrent somatic alterations in significantly mutated genes across the cohort (N = 93) as analyzed by MutSig2CV. TP53, GATA3, ARID1A, MAP3K1, PIK3CA, and SLC22A2 are significantly mutated. The P values were computed using the Fisher method and truncated product method. FDR (q values) were generated using the Benjamini–Hochberg method to correct for multiple hypotheses. Genes that have a −log10 q-value ≥1 (red line) are considered significant. Bar graph (top) depicts the TMB (mutations/megabase) of each patient's tumor samples, followed by clinical annotations depicting histology, disease recurrence, and breast cancer subtype (key to the right of panel). Bottom panel annotations show cancer-specific pathogenic germline variants, and somatic mutational signatures of homologous recombination (HR) deficiency, APOBEC activity, and microsatellite instability (MSI).

Significant SNVs, short indels, and signature analysis. Comutation plot showing recurrent somatic alterations in significantly mutated genes across the cohort (N = 93) as analyzed by MutSig2CV. TP53, GATA3, ARID1A, MAP3K1, PIK3CA, and SLC22A2 are significantly mutated. The P values were computed using the Fisher method and truncated product method. FDR (q values) were generated using the Benjamini–Hochberg method to correct for multiple hypotheses. Genes that have a −log10 q-value ≥1 (red line) are considered significant. Bar graph (top) depicts the TMB (mutations/megabase) of each patient's tumor samples, followed by clinical annotations depicting histology, disease recurrence, and breast cancer subtype (key to the right of panel). Bottom panel annotations show cancer-specific pathogenic germline variants, and somatic mutational signatures of homologous recombination (HR) deficiency, APOBEC activity, and microsatellite instability (MSI).