. 2022 Mar 15;82(6):1140–1152. doi: 10.1158/0008-5472.CAN-21-2997

Figure 5.

Figure 5. AZD6738 combination with the PARP inhibitor olaparib. A, AZD6738 potentiates the activity of olaparib and shows synergistic growth inhibition of BRCA1-mutant (Δ11q) UWB1.289 cells preferentially over UWB1.289+BRCA1–complemented cells. Representative growth inhibition plots are shown. B, Metaphase spreads for AZD6738 and olaparib combination shows a synergistic increase in chromosomal aberrations in UWB1.289 compared with UWB1.289+BRCA1–complemented cells. C and D, In vivo efficacy of olaparib in combination with AZD6738 in TNBC PDX models using 50 mg/kg once daily olaparib plus 25 mg/kg AZD6738 on 5 days-on/2 days-off weekly schedule (×6) in HBCx-9 BRCA WT (C) or HBCx-10 BRCA2-mutant model (D). Mean tumor volume ± SEM is shown. Olaparib and AZD6738 combination pharmacodynamics by IHC in HBCx-9 WT and HBCx-10 BRCA2-mutant models. E–H, Representative images at 6 hours post last dose (left) and quantification (% positive cells; right) for γH2AX in HBCx-9 (E) or HBCx-10 (F), and pRAD50 pSer635 in HBCx-9 (G) or HBCx-10 (H) models. Scale bars, 100 μm. *, P ≤ 0.05; **, P ≤ 0.01; ***, P ≤ 0.001; ****, P ≤ 0.0001.

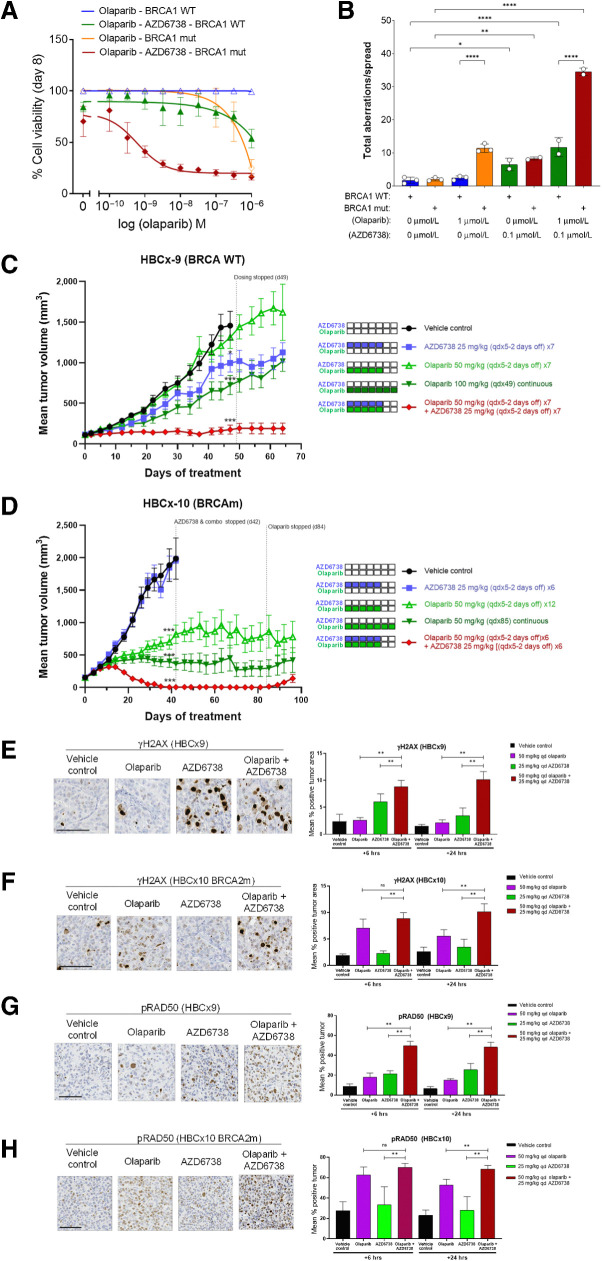
AZD6738 combination with the PARP inhibitor olaparib. A, AZD6738 potentiates the activity of olaparib and shows synergistic growth inhibition of BRCA1-mutant (Δ11q) UWB1.289 cells preferentially over UWB1.289+BRCA1–complemented cells. Representative growth inhibition plots are shown. B, Metaphase spreads for AZD6738 and olaparib combination shows a synergistic increase in chromosomal aberrations in UWB1.289 compared with UWB1.289+BRCA1–complemented cells. C and D,In vivo efficacy of olaparib in combination with AZD6738 in TNBC PDX models using 50 mg/kg once daily olaparib plus 25 mg/kg AZD6738 on 5 days-on/2 days-off weekly schedule (×6) in HBCx-9 BRCA WT (C) or HBCx-10 BRCA2-mutant model (D). Mean tumor volume ± SEM is shown. Olaparib and AZD6738 combination pharmacodynamics by IHC in HBCx-9 WT and HBCx-10 BRCA2-mutant models. E–H, Representative images at 6 hours post last dose (left) and quantification (% positive cells; right) for γH2AX in HBCx-9 (E) or HBCx-10 (F), and pRAD50 pSer635 in HBCx-9 (G) or HBCx-10 (H) models. Scale bars, 100 μm. *, P ≤ 0.05; **, P ≤ 0.01; ***, P ≤ 0.001; ****, P ≤ 0.0001.