. 2021 Dec 13;82(4):543–555. doi: 10.1158/0008-5472.CAN-21-2117

Figure 1.

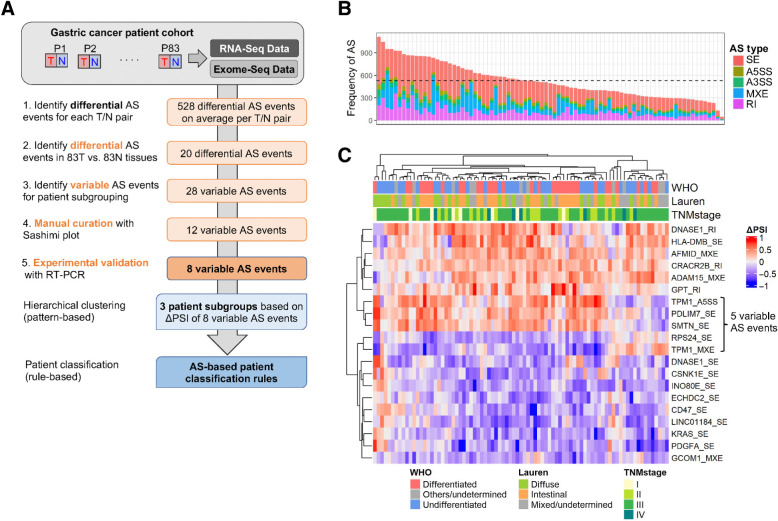
Figure 1. Cancer-associated AS events in gastric tumors. A, Summary of AS-based patient classification scheme. N, normal tissue; P, patient; SNU, Seoul National University; T, tumor. B, Number of differential AS events in tumor versus normal pairs, colored by event type (SE, skipped exon; A5/3SS, alternative 5′/3′ splice site; MXE, mutually exclusive exons; RI, retained intron). The mean number of AS events is shown as a horizontal dashed line. C, Differential AS events in 83 tumors versus normal tissues, plotted as ΔPSI values for each patient. WHO and Lauren classification, as well as tumor stage, are shown.

Cancer-associated AS events in gastric tumors. A, Summary of AS-based patient classification scheme. N, normal tissue; P, patient; SNU, Seoul National University; T, tumor. B, Number of differential AS events in tumor versus normal pairs, colored by event type (SE, skipped exon; A5/3SS, alternative 5′/3′ splice site; MXE, mutually exclusive exons; RI, retained intron). The mean number of AS events is shown as a horizontal dashed line. C, Differential AS events in 83 tumors versus normal tissues, plotted as ΔPSI values for each patient. WHO and Lauren classification, as well as tumor stage, are shown.