. 2021 Dec 13;82(4):543–555. doi: 10.1158/0008-5472.CAN-21-2117

Figure 6.

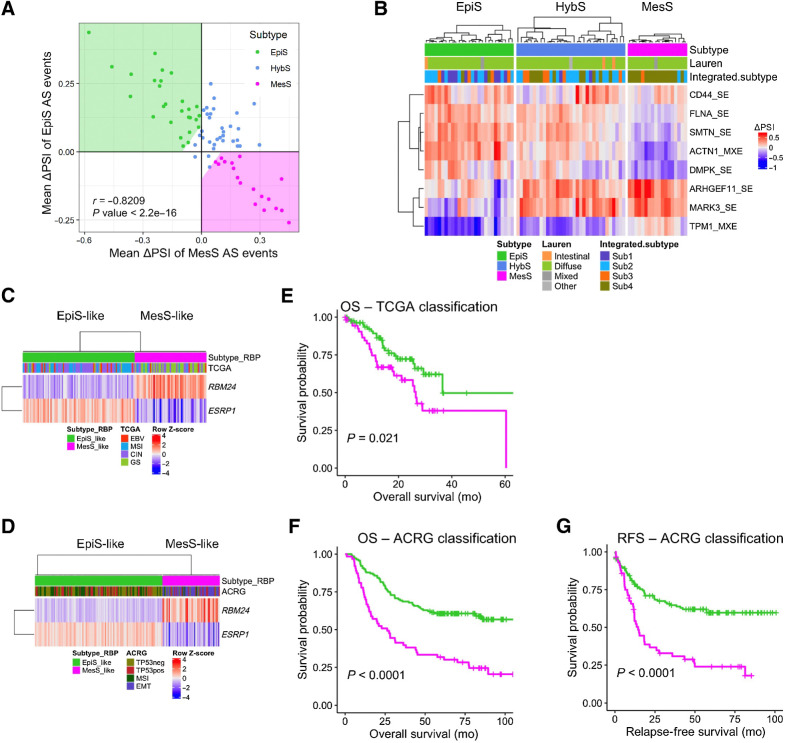
Figure 6. Validation of AS-based subtype classification in independent datasets. A, Scatter plot of patients from Hwang's cohort using meanΔPSI of AS event-based EpiS and MesS tumor subtypes, colored by subtype. B, AS event-based patient classification applied to Hwang's cohort. Patient clinical classification by Lauren and their integrated subtype are shown. C and D, RBP-based classification of TCGA (C) and ACRG (D) patients according to RBM24 and ESRP1 expression. E and F, Kaplan–Meier plot for OS between EpiS-like and MesS-like RBP-subtypes in TCGA (E) and ACRG (F) cohorts (log-rank test P values). G, Kaplan–Meier plot for relapse-free survival between EpiS-like and MesS-like RBP-subtypes in the ACRG cohort (log-rank test P values).

Validation of AS-based subtype classification in independent datasets. A, Scatter plot of patients from Hwang's cohort using meanΔPSI of AS event-based EpiS and MesS tumor subtypes, colored by subtype. B, AS event-based patient classification applied to Hwang's cohort. Patient clinical classification by Lauren and their integrated subtype are shown. C and D, RBP-based classification of TCGA (C) and ACRG (D) patients according to RBM24 and ESRP1 expression. E and F, Kaplan–Meier plot for OS between EpiS-like and MesS-like RBP-subtypes in TCGA (E) and ACRG (F) cohorts (log-rank test P values). G, Kaplan–Meier plot for relapse-free survival between EpiS-like and MesS-like RBP-subtypes in the ACRG cohort (log-rank test P values).