Figure 1.
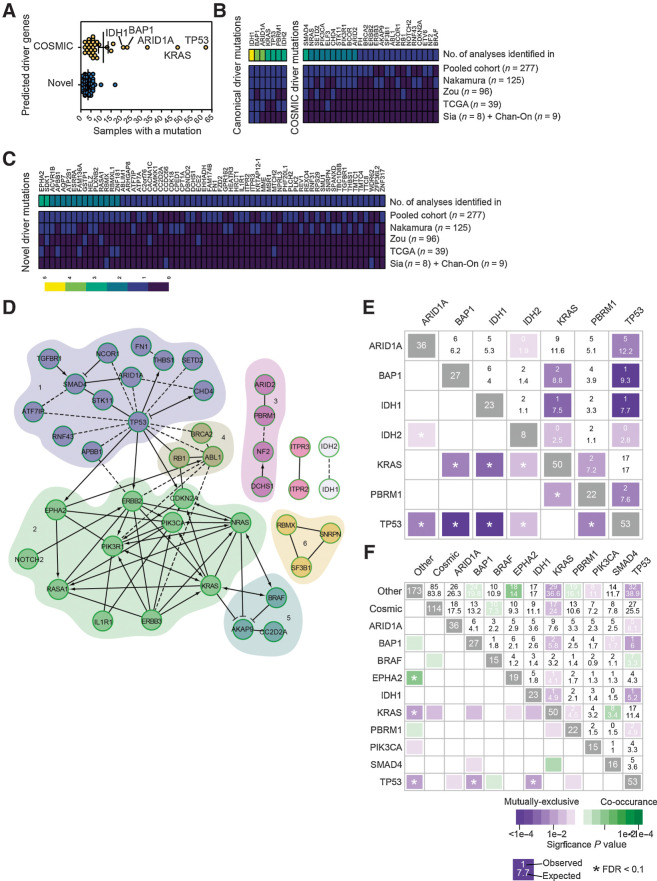
In silico screening identifies novel drivers of ICC. A, The number of samples with mutations in driver genes identified following analysis with IntOGen. Samples clustered into those that had been previously identified in ICC or are present in the COSMIC database (yellow points), or those mutated genes that have not previously been assigned as being cancer drivers (blue points). B, Frequency of samples containing known ICC or COSMIC mutation in each of the individual cohorts collated in this study and in the pooled datasets. C, Frequency of samples containing a predicted novel oncogenic mutation identified by IntOGen. In both B and C, heatmaps represent the frequency at which each mutation is found within each study and the aggregated frequency between all studies. Top bar represents the number of times a mutation was identified between studies. D, Pathway interaction analysis of putative ICC driver mutations identified by IntOGen based on known functional (solid lines) and predicted physical (dotted lines) interactions. Numbers 1 to 6 represent distinct gene relationship modules based on predicted or known genetic interactions. E, Co-occurrence and mutual exclusivity analysis demonstrates that there is a high level of mutational exclusivity between canonical driver mutations in patients with ICC. F, Co-occurrence and mutual exclusivity of COSMIC drivers that co-occur ≥15 times in the human sample set and combined “other,” which includes all novel drivers. N = 277 patient exomes or genomes with matched, noncancerous tissue.

