. 2022 Jan 24;82(8):1548–1559. doi: 10.1158/0008-5472.CAN-21-2556

Figure 2.

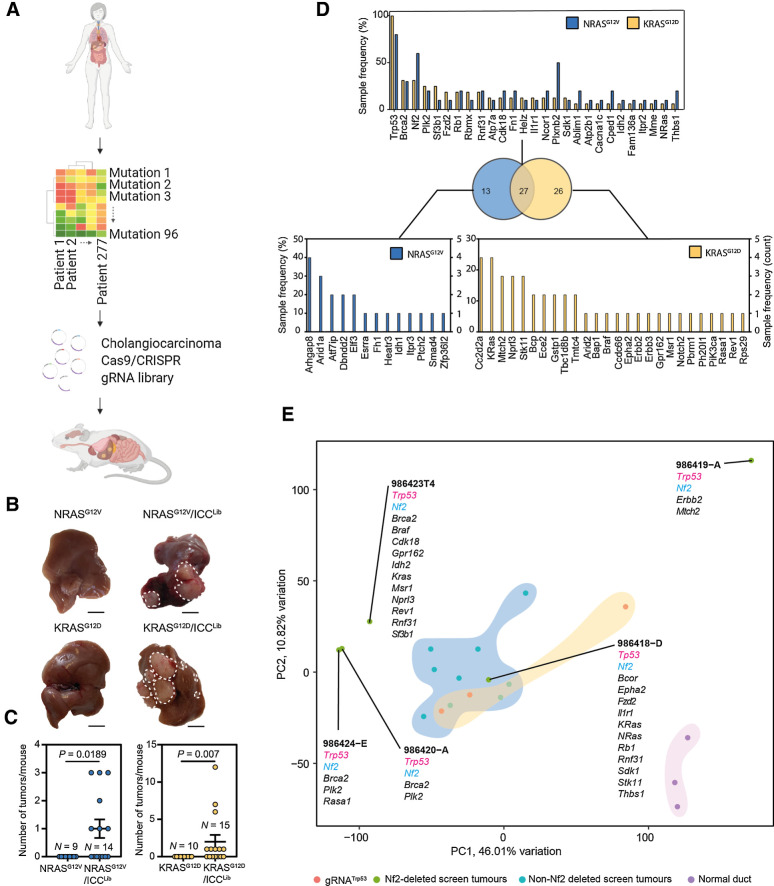
Figure 2. In vivo CRISPR-Cas9 screening identifies transforming mutations that interact with mutant Ras. A, Schematic of this study in which high-content sequencing data are collated from patients with ICC and the mutational profile of these tumors rationalized to identify novel, high confidence drivers of ICC. These putative drivers are used as input for an in vivo SpCas9/CRISPR screen to identify novel functional processes that drive ICC growth. B, Macroscopic images of the livers following injection with either NRASG12V or KRASG12D alone (left) or in combination with ICCLib (right; dotted line, tumor). Scale bar, 1 cm. C, Quantification of macroscopic tumors per mouse at 10 weeks in mice bearing NrasG12V -expressing tumors and 8 weeks in those with KrasG12D-driven cancer. Each circle represents a different animal. D, The number of samples containing Indels in a particular gene following whole exome sequencing. Top graph lists those mutations found in both NRASG12V and KRASG12D tumors, and bottom graphs denote those mutations that are found only in KRASG12D - or NRASG12V -expressing tumors. Sample frequency (%) denotes the proportion of tumors containing any given mutation, whereas (count) is absolute number. (N represents anatomically discreet tumors recovered from at least four individual animals, KRASG12D N = 14 and NRASG12V N = 10.) E, PCA showing how samples group based on their transcriptomic signature and gRNA-induced mutations associated with each tumor type.

In vivo CRISPR-Cas9 screening identifies transforming mutations that interact with mutant Ras. A, Schematic of this study in which high-content sequencing data are collated from patients with ICC and the mutational profile of these tumors rationalized to identify novel, high confidence drivers of ICC. These putative drivers are used as input for an in vivo SpCas9/CRISPR screen to identify novel functional processes that drive ICC growth. B, Macroscopic images of the livers following injection with either NRASG12V or KRASG12D alone (left) or in combination with ICCLib (right; dotted line, tumor). Scale bar, 1 cm. C, Quantification of macroscopic tumors per mouse at 10 weeks in mice bearing NrasG12V -expressing tumors and 8 weeks in those with KrasG12D-driven cancer. Each circle represents a different animal. D, The number of samples containing Indels in a particular gene following whole exome sequencing. Top graph lists those mutations found in both NRASG12V and KRASG12D tumors, and bottom graphs denote those mutations that are found only in KRASG12D - or NRASG12V -expressing tumors. Sample frequency (%) denotes the proportion of tumors containing any given mutation, whereas (count) is absolute number. (N represents anatomically discreet tumors recovered from at least four individual animals, KRASG12DN = 14 and NRASG12VN = 10.) E, PCA showing how samples group based on their transcriptomic signature and gRNA-induced mutations associated with each tumor type.