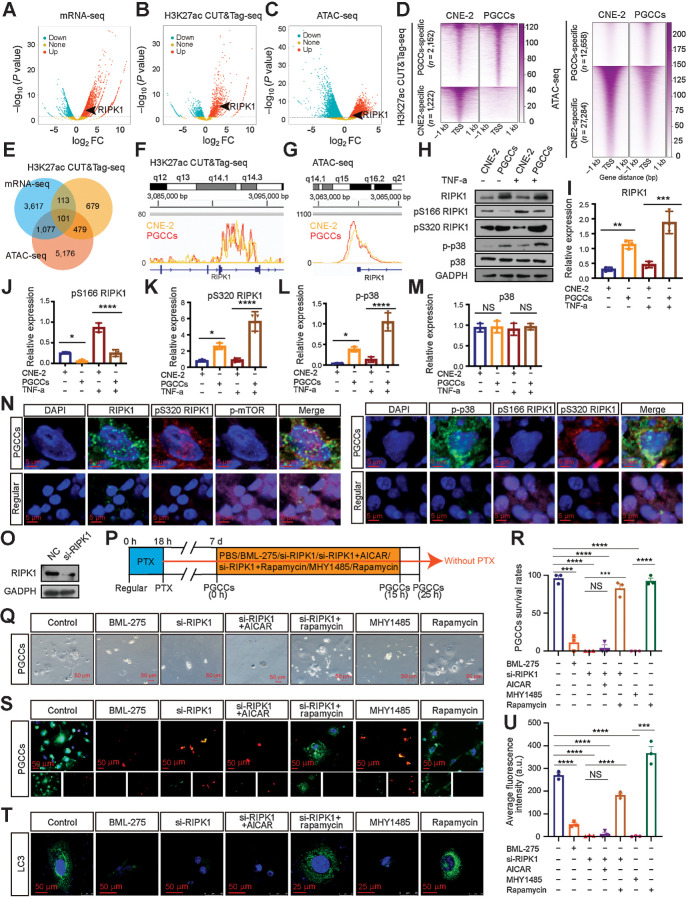
Figure 5.
RIPK1 acts as a scaffold to promote PGCC survival by the AMPK-mTOR pathway. A–C, Volcano plot showing the log2-fold change (FC) vs.–log10 (P value) of differential mRNA expression (A), H3K27ac enrichment (B), and ATAC enrichment (C) identified between PGCCs and CNE-2 cells. Significantly up or down are selected according to P < 0.05. D, Heatmap of H3K27ac and ATAC signals at sites unique for PGCCs and CNE-2 cells. Signal density measured ±1 kb from the center regions is defined as tag density/bp. E, Venn diagram. F and G, H3K27ac CUT&Tag-seq signals (F) and ATAC-seq signals (G) at RIPK1 loci. H, Western blot analysis. I–M, Gray value analysis of Western blot. N, IF costaining in PGCCs and regular CNE-2 cells. O, Interference efficiency was detected by Western blot. P, Experimental design for investigating the role of autophagy in PGCC survival. Q, Rescue experiments for PGCC survival. R, Quantification of PGCC number. S, PGCCs viability analysis via LIVE/DEAD Viability assay. Scale bars, 50 μm. T, Endogenous LC3 puncta were detected using IF. U, Quantification of average fluorescence intensity per cell (one-way ANOVA). All data represent the mean ± SEM of at least three independent experiments. P values were calculated using one-way ANOVA. *, P < 0.05; **, P < 0.01; ***, P < 0.001; ****, P < 0.0001; NS, not significant. a.u., arbitrary units; mRNA-seq, mRNA sequencing; PTX, paclitaxel.

