. 2022 Mar 3;82(5):846–858. doi: 10.1158/0008-5472.CAN-21-2342

Figure 6.

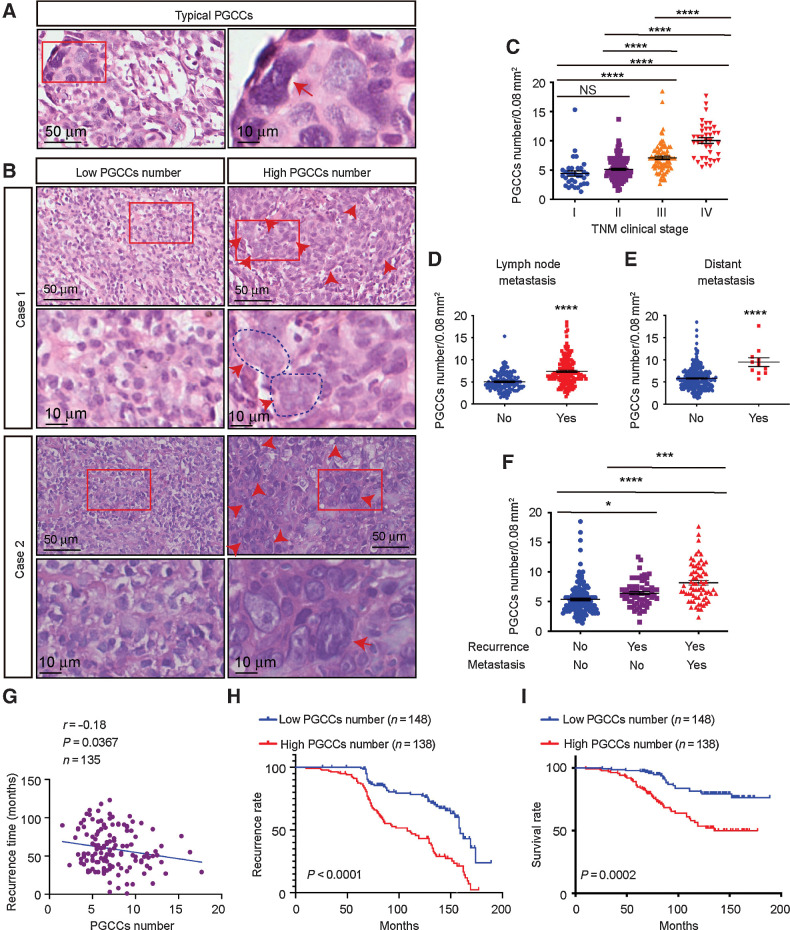
Figure 6. Presence and clinical significance of PGCCs in NPC. A, Representative hematoxylin and eosin staining of typical PGCCs in NPC tissue sections. B, Representative image of PGCCs in NPC tissue microarrays. C–F, PGCC number in different clinical stages (C), lymph node metastases (D), distant metastases (E), and recurrence (F). G, Pearson correlation between recurrence time and PGCC number (linear regression). H and I, Kaplan–Meier analysis was used to compare overall recurrence (H) and overall survival (log-rank test; I). All data represent the mean ± SEM of at least three independent experiments. P values were calculated using one-way ANOVA. *, P < 0.05; ***, P < 0.001; ****, P < 0.0001; NS, not significant.

Presence and clinical significance of PGCCs in NPC. A, Representative hematoxylin and eosin staining of typical PGCCs in NPC tissue sections. B, Representative image of PGCCs in NPC tissue microarrays. CF, PGCC number in different clinical stages (C), lymph node metastases (D), distant metastases (E), and recurrence (F). G, Pearson correlation between recurrence time and PGCC number (linear regression). H and I, Kaplan–Meier analysis was used to compare overall recurrence (H) and overall survival (log-rank test; I). All data represent the mean ± SEM of at least three independent experiments. P values were calculated using one-way ANOVA. *, P < 0.05; ***, P < 0.001; ****, P < 0.0001; NS, not significant.