. 2022 Mar 15;82(10):1937–1952. doi: 10.1158/0008-5472.CAN-21-3038

Figure 1.

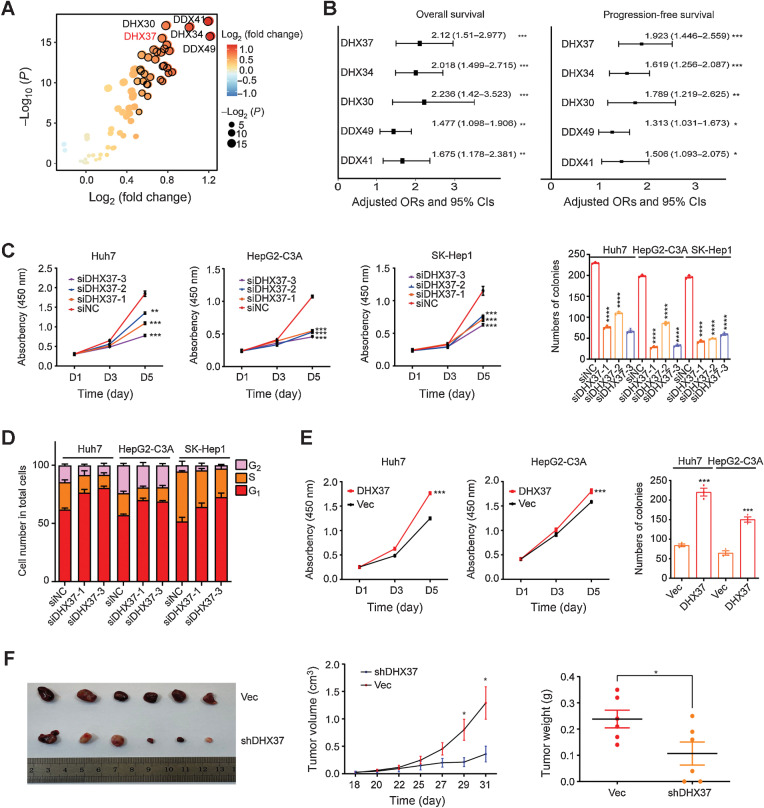
Figure 1. High expression of DHX37 correlates with poor outcomes in patients with HCC and promotes liver cancer cell proliferation both in vitro and in vivo. A, Comparison of RNA helicase family member expression between tumor tissues and normal tissues in TCGA-LIHC cohort. The horizontal axis shows differences in gene expression between tumor tissues and normal tissues, and the vertical axis shows the significance of the differences. The color of the points in the figure represents the fold differences, and the size of the points represents the significance of the differences. P values by two-sided Student t test. B, Association of RNA helicase family member expression with patient OS and PFS times in TCGA-LIHC cohort based on univariate Cox regression analysis. HR > 1 indicates that the gene is a risk factor. C, CCK-8 assays and colony formation assays of the Huh7, HepG2-C3A, and SK-Hep1 cells transfected with three independent DHX37 siRNAs (n = 3). D, Flow cytometric analysis of the cell-cycle distribution in the liver cancer cells transfected with two independent DHX37 siRNAs (n = 3). E, CCK-8 assays and colony formation assays of the Huh7 and HepG2-C3A cells with stable DHX37 overexpression (n = 3). F, Images of xenografts from nude mice bearing subcutaneous xenografts derived from the shDHX37 cells or control cells. Tumor volumes and tumor weights were measured in the shDHX37 and negative control groups of xenograft mice (n = 6). The values are expressed as the mean ± SEM. ****, P < 0.0001; ***, P < 0.001; **, P < 0.01; and *, P < 0.05 by one-way ANOVA or two-sided Student t test.

High expression of DHX37 correlates with poor outcomes in patients with HCC and promotes liver cancer cell proliferation, both in vitro and in vivo. A, Comparison of RNA helicase family member expression between tumor tissues and normal tissues in TCGA-LIHC cohort. The horizontal axis shows differences in gene expression between tumor tissues and normal tissues, and the vertical axis shows the significance of the differences. The color of the points in the figure represents the fold differences, and the size of the points represents the significance of the differences. P values by two-sided Student t test. B, Association of RNA helicase family member expression with patient OS and PFS times in TCGA-LIHC cohort based on univariate Cox regression analysis. HR > 1 indicates that the gene is a risk factor. C, CCK-8 assays and colony formation assays of the Huh7, HepG2-C3A, and SK-Hep1 cells transfected with three independent DHX37 siRNAs (n = 3). D, Flow cytometric analysis of the cell-cycle distribution in the liver cancer cells transfected with two independent DHX37 siRNAs (n = 3). E, CCK-8 assays and colony formation assays of the Huh7 and HepG2-C3A cells with stable DHX37 overexpression (n = 3). F, Images of xenografts from nude mice bearing subcutaneous xenografts derived from the shDHX37 cells or control cells. Tumor volumes and tumor weights were measured in the shDHX37 and negative control groups of xenograft mice (n = 6). The values are expressed as the mean ± SEM. *, P < 0.05; **, P < 0.01; ***, P < 0.001; ****, P < 0.0001 by one-way ANOVA or two-sided Student t test.