. 2022 Mar 15;82(10):1937–1952. doi: 10.1158/0008-5472.CAN-21-3038

Figure 5.

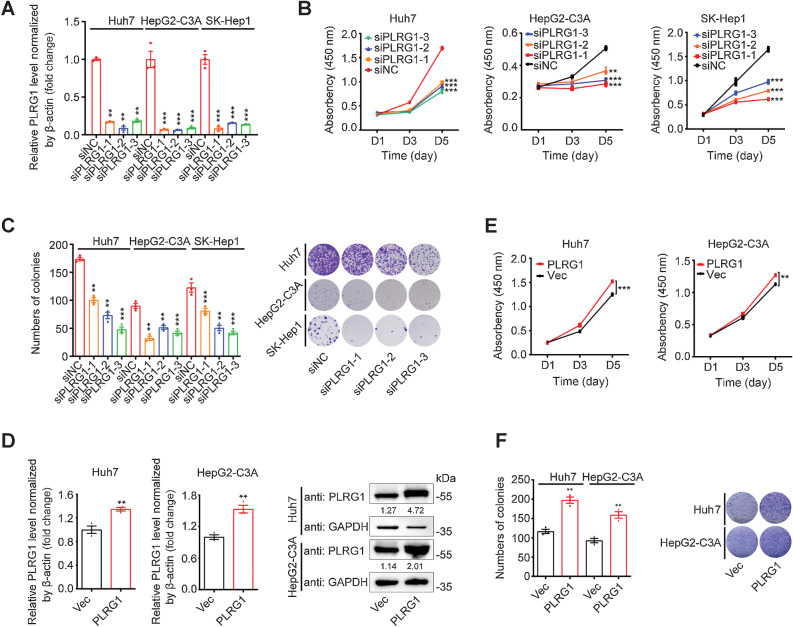
Figure 5. PLRG1 promotes HCC cell proliferation. A, qRT-PCR analysis of PLRG1 knockdown efficiency after transfection of Huh7, HepG2-C3A, and SK-Hep1 cells with three independent PLRG1 siRNAs. B, CCK-8 assays in the Huh7, HepG2-C3A, and SK-Hep1 cells transfected with three independent PLRG1 siRNAs. C, Colony formation assays and colony counts in the Huh7, HepG2-C3A, and SK-Hep1 cells transfected with three independent PLRG1 siRNAs. D, qRT-PCR and WB analysis of PLRG1 overexpression efficiency in stable pCDH-PLRG1 Huh7 and HepG2-C3A cells. E, CCK-8 assays in stable PLRG1-overexpressing and control Huh7 and HepG2-C3A cells. F, Colony formation assays and colony counts in stable PLRG1-overexpressing and control Huh7 and HepG2-C3A cells. The values are expressed as the mean ± SEM (A–F, n = 3). ****, P < 0.0001; ***, P < 0.001; and **, P < 0.01 by one-way ANOVA or two-sided Student t test.

PLRG1 promotes HCC cell proliferation. A, qRT-PCR analysis of PLRG1 knockdown efficiency after transfection of Huh7, HepG2-C3A, and SK-Hep1 cells with three independent PLRG1 siRNAs. B, CCK-8 assays in the Huh7, HepG2-C3A, and SK-Hep1 cells transfected with three independent PLRG1 siRNAs. C, Colony formation assays and colony counts in the Huh7, HepG2-C3A, and SK-Hep1 cells transfected with three independent PLRG1 siRNAs. D, qRT-PCR and Western blot analysis of PLRG1 overexpression efficiency in stable pCDH-PLRG1 Huh7 and HepG2-C3A cells. E, CCK-8 assays in stable PLRG1-overexpressing and control Huh7 and HepG2-C3A cells. F, Colony formation assays and colony counts in stable PLRG1-overexpressing and control Huh7 and HepG2-C3A cells. The values are expressed as the mean ± SEM (A–F, n = 3). **, P < 0.01; ***, P < 0.001 by one-way ANOVA or two-sided Student t test.