
Figure 2.
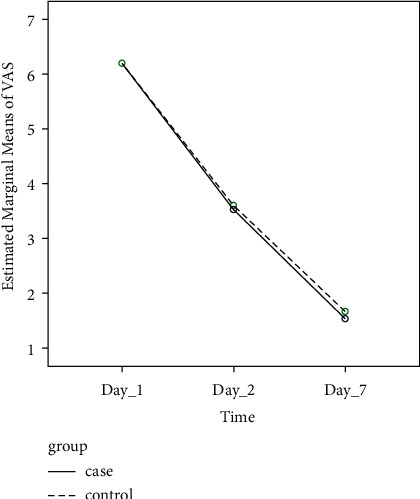
Line chart of the pattern of pain changes on different days between the intervention and control groups.
Official websites use .gov
A
.gov website belongs to an official
government organization in the United States.
Secure .gov websites use HTTPS
A lock (
) or https:// means you've safely
connected to the .gov website. Share sensitive
information only on official, secure websites.
Line chart of the pattern of pain changes on different days between the intervention and control groups.