
FIGURE 5.
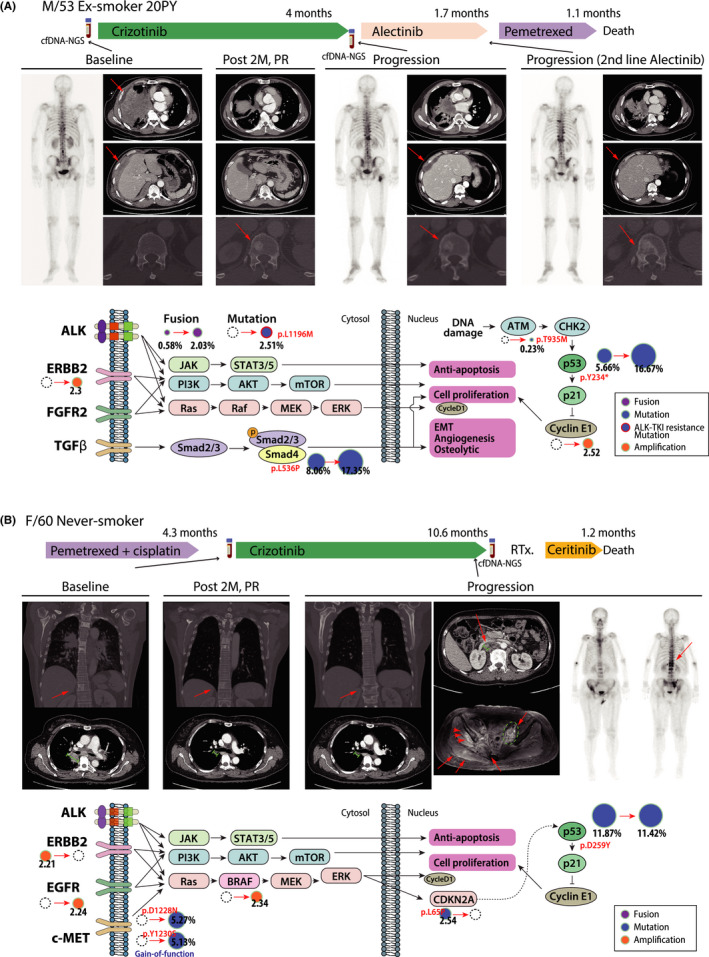
Patients who were annotated bypass signaling activation by cfDNA‐NGS monitoring showed resistance to ALK‐TKI. (A, B) The treatment summary is displayed on the upper panel. The images of whole‐body bone scan and enhance computerized tomography (CT) during treatment are displayed on the middle panel. A diagram of the signaling pathway demonstrates the principal changes between pretreatment and at progression in cfDNA‐NGS and the resistance mechanisms of ALK acquired resistance mutation and bypass signaling activation. The size of the circle represents allele frequency (%) of fusion, indel or mutation, or copy number