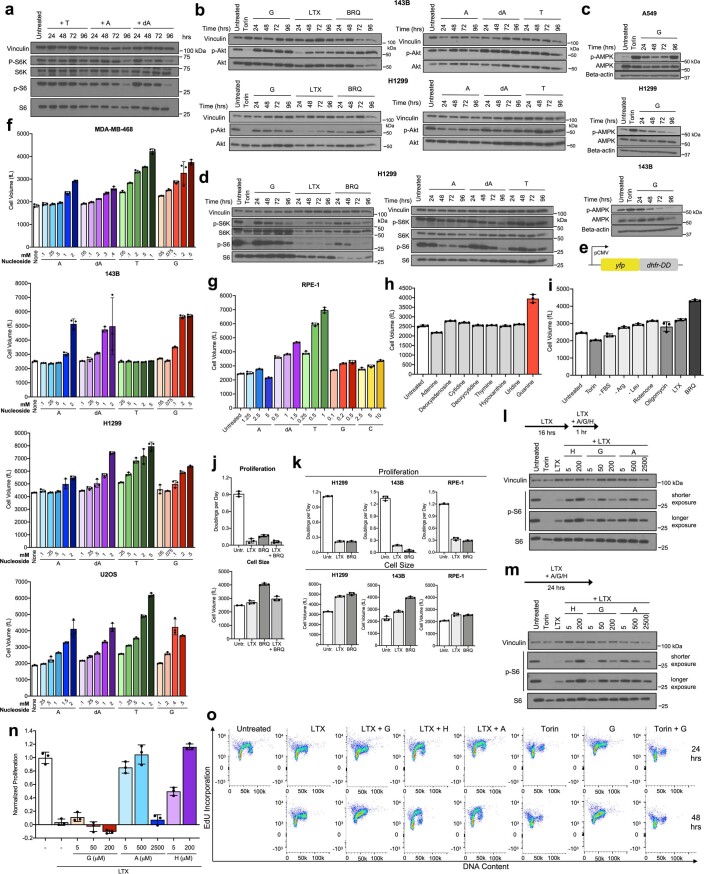
Extended Data Fig. 4. Under nucleotide imbalance, continued cell growth and S phase entry do not correlate with changes in growth signaling.
a, Western blot assessing phosphorylation of ribosomal protein S6 and S6 kinase (S6K) in A549 cells cultured in standard conditions (Untreated) or treated with 1 mM thymidine (T), 2.5 mM adenine (A), or 1.5 mM deoxyadenosine (dA) for the indicated time. Levels of vinculin, total S6K, and total S6 are also shown as controls. b, Western blots assessing phosphorylation of Akt in 143B cells (top) and H1299 cells (bottom) cultured in standard conditions (Untreated) or treated with 1 µM Torin, 200 µM guanine (G), 1 µM lometrexol (LTX), 1 µM brequinar (BRQ), 1 mM T, 2.5 mM A, or 1.5 mM dA for the indicated time. Levels of vinculin and total Akt are also shown as controls. c, Western blots assessing phosphorylation of AMPK in A549, H1299, or 143B cells cultured in standard conditions (Untreated) or treated with 1 µM Torin or 200 µM G for the indicated time. Levels of vinculin and total AMPK are also shown as controls. d, Western blots assessing phosphorylation of ribosomal protein S6 and S6K in H1299 cells cultured in standard conditions (Untreated) or treated with 1 µM Torin, 200 µM G, 1 µM LTX, 1 µM BRQ, 1 mM T, 2.5 mM A, or 1.5 mM dA for the indicated time. Levels of vinculin, total S6K, and total S6 are also shown as controls. e, Schematic of a protein synthesis reporter construct where a CMV promoter drives expression of YFP fused to an engineered unstable E. coli dihydrofolate reductase that acts as a degron (dhfr-DD). f, Mean volume of the indicated cells cultured in standard conditions (None) or treated for 96 hours with the indicated concentration of A, dA, T, or G. 143B cells are deficient for thymidine kinase, and therefore cannot salvage thymidine to produce dTMP. g, Mean volume of RPE-1 cells cultured in standard conditions (None) or treated for 96 hours with the indicated concentration of A, dA, T, G, or cytidine (C). h, Mean volume of A549 cells cultured in standard conditions (Untreated) or treated with 200 µM of the indicated nucleobase/nucleoside for 96 hours. i, Mean volume of A549 cells cultured for 96 hours in standard culture conditions (Untreated), or with 1 µM Torin1, without serum (-FBS), without arginine (-Arg), without leucine (-Leu), with 100 nM rotenone, with 5 nM oligomycin, with 1 µM LTX, or with 1 µM BRQ as indicated. j, Proliferation rate (top) and mean volume (bottom) of A549 cells cultured in standard conditions (Untr.) or treated for 96 hours with 1 µM LTX, 1 µM BRQ, or both LTX and BRQ as indicated. k, Proliferation rate (top) and mean volume (bottom) of H1299, 143B, and RPE-1 cells cultured in standard conditions (Untr.) or treated for 96 hours with 1 µM LTX or 1 µM BRQ as indicated. l, Phosphorylation of ribosomal protein S6 in A549 cells cultured for 16 hours in standard conditions (Untreated) or with 1 µM LTX, then supplemented for 1 hour with the indicated concentrations in µM of hypoxanthine (H), G, or A. Levels of vinculin and total S6 are also shown as controls. m, Phosphorylation of ribosomal protein S6 in A549 cells cultured for 24 hours in standard conditions (Untreated) or treated with 1 µM LTX with or without the indicated concentrations in µM of H, G, or A. Levels of vinculin and total S6 are also shown as controls. n, Proliferation rates of A549 cells cultured in media with or without 1 µM LTX, and with or without the indicated concentrations of G, A, or H. o, Cell cycle distribution of A549 cells cultured in standard conditions (Untreated), or with 1 µM LTX with or without 200 µM G, 200 µM H, or 200 µM A as indicated, or with 10 µM Torin, 200 µM G, or both Torin and G for the indicated time. Cells were pulsed with EdU for 30 minutes after each treatment and then analyzed as outlined in Fig. 3a. Data are presented as mean ± SD of 3 biological replicates. Source numerical data and unprocessed blots are available in source data.

