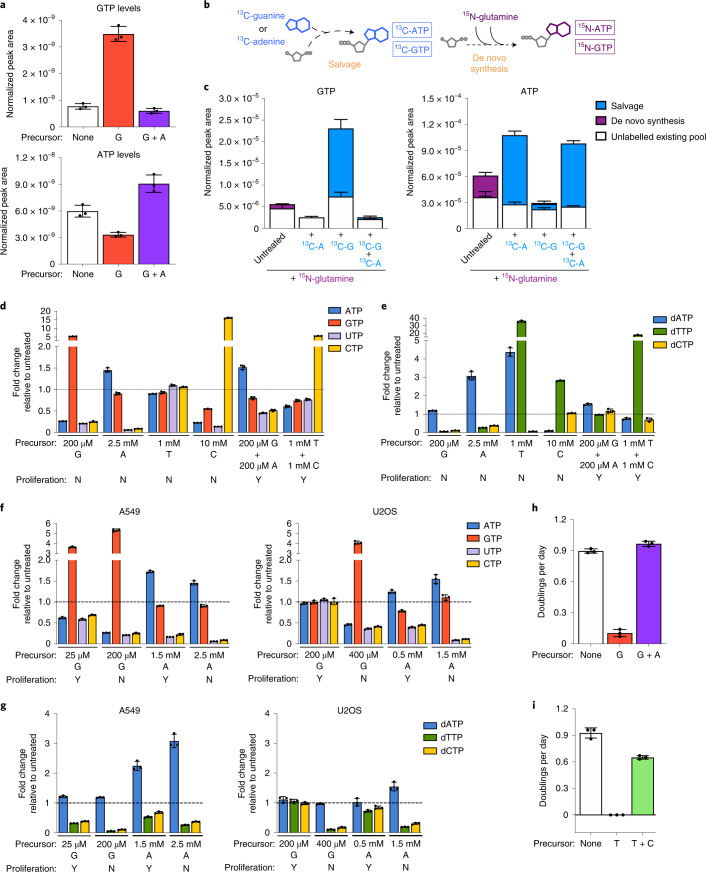
Fig. 2. Nucleotide salvage leading to imbalanced nucleotide pools inhibits cell proliferation.
a, GTP and ATP levels in A549 cells cultured in standard conditions (none) or treated for 24 h with 200 µM guanine (G) with or without 200 µM adenine (A) as indicated. b, Schematic showing how stable isotope tracing was used to determine the source of intracellular purines. Salvage of 13C-guanine or 13C-adenine produces 13C-labelled GTP and ATP. The 15N label from amide-15N-glutamine is incorporated in de novo purine synthesis, producing 15N-labelled ATP and GTP. c, Total levels and labelling of GTP and ATP in A549 cells cultured for 24 h in medium containing amide-15N-glutamine with or without 200 µM 13C-guanine and/or 13C-adenine as indicated. d, Fold change in the specified intracellular NTP levels in A549 cells cultured with the indicated concentrations of nucleotide precursors compared with those found in cells cultured in standard conditions. e, Fold change in the specified intracellular dNTP levels in A549 cells cultured with the indicated concentrations of nucleotide precursors compared with those found in cells cultured in standard conditions. f, Fold change in the specified intracellular NTP levels in A549 or U2OS cells cultured with the indicated concentrations of nucleotide precursors compared with those found in cells cultured in standard conditions. g, Fold change in the specified intracellular dNTP levels in A549 or U2OS cells cultured with the indicated concentrations of nucleotide precursors compared with those found in cells cultured in standard conditions. h, Proliferation rates of A549 cells cultured in standard conditions (none) or treated with 200 µM G with or without 200 µM A. i, Proliferation rates of A549 cells cultured in standard conditions (none) or treated with 1 mM T with or without 1 mM C. All nucleotide levels were measured using LCMS. Fold changes in nucleotide levels were calculated from absolute concentrations presented in Extended Data Fig. 2d–g. Data are presented as mean + /- SD of 3 biological replicates. Source numerical data are available in source data.

