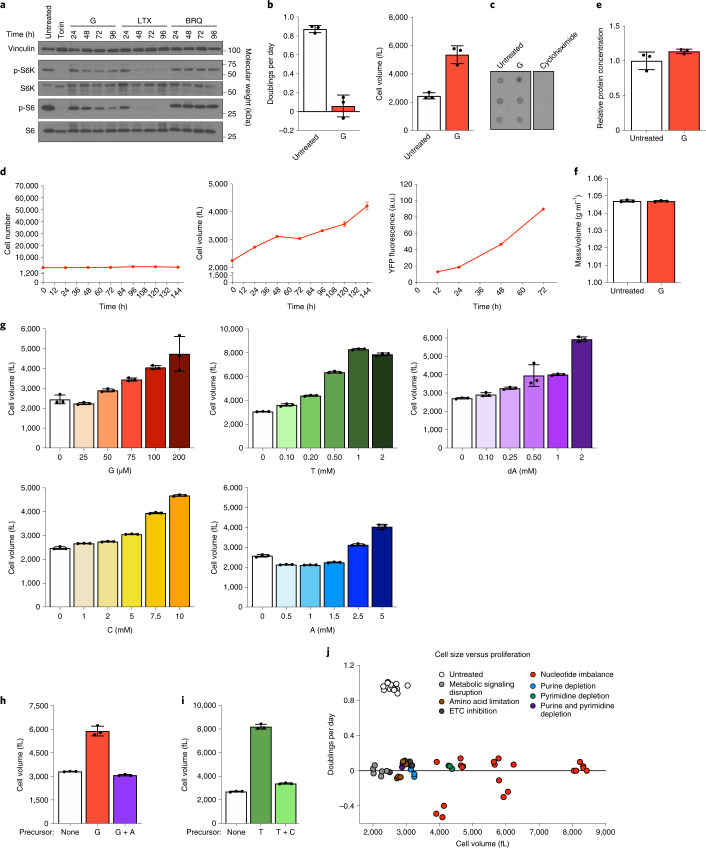
Fig. 4. Nucleotide imbalance causes continued cell growth without division.
a, Phosphorylation of ribosomal protein S6 and S6 kinase (S6K) in A549 cells cultured with or without 1 µM Torin 1, or 200 µM guanine (G), 1 µM lometrexol (LTX) or 1 µM brequinar (BRQ) for the indicated time. Levels of vinculin, total S6K and total S6 are also shown. b, Proliferation rate (left) and mean volume (right) of A549 cells cultured with or without 200 µM G. c, Global protein synthesis measured by puromycin incorporation into nascent peptides in A549 cells cultured with or without 200 µM G for 96 h. Cycloheximide treatment was used as a negative control. d, Cell number (left), mean volume (centre) and protein accumulation (right) in A549 cells treated with 200 µM G. Protein accumulation was determined using a YFP reporter (Extended Data Fig. 4e). e, Protein concentration in A549 cells cultured with or without 200 µM G, calculated by dividing total protein by cell number and volume. f, Density of A549 cells cultured with or without 200 µM G for 72 h, calculated by dividing cell mass by cell volume. g, Mean volume of A549 cells treated for 96 h with the indicated concentrations of G, thymidine (T), deoxyadenosine (dA), cytidine (C) or adenine (A). h, Mean volume of A549 cells cultured with or without 200 µM G with or without 200 µM A for 96 h. i, Mean volume of A549 cells cultured with or without 1 mM T with or without 1 mM C for 96 h. j, Proliferation rate and size of A549 cells cultured in conditions that perturb cell metabolism. Data are compiled from experiments shown in Figs. 1a–f, 2h,i and 4g–i, and Extended Data Fig. 4j. Conditions are grouped into signalling disruption (Torin treatment or serum withdrawal), amino acid limitation (leucine or arginine starvation), electron transport chain (ETC) inhibition (oligomycin or rotenone treatment), purine or pyrimidine depletion (using LTX or BRQ), or nucleotide imbalance. Data are presented as mean ± s.d. of three biological replicates. Source numerical data and unprocessed blots are available in source data.

