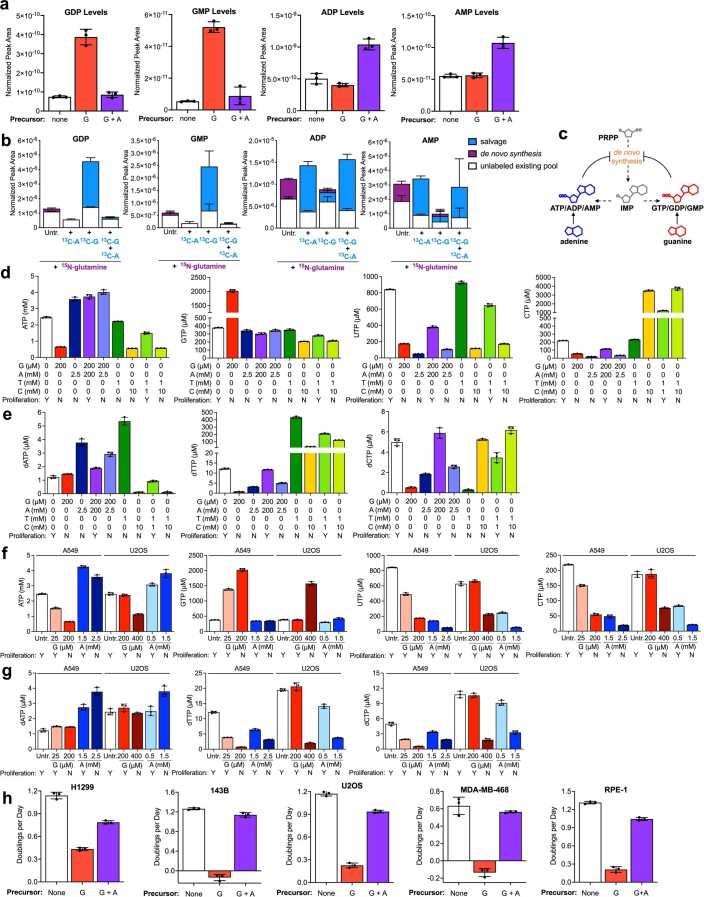
Extended Data Fig. 2. Salvage of excess nucleotide precursors can induce nucleotide imbalance and impair proliferation.
a, Levels of the indicated nucleotides in A549 cells cultured in standard conditions (none) or treated for 24 hours with 200 µM guanine (G) with or without 200 µM adenine (A) as indicated. b, Total levels and labeling of the indicated nucleotides in A549 cells cultured for 24 hours in media containing 15N-amide-glutamine with or without 200 µM 13C-guanine (13C-G) and/or 13C-adenine (13C-A) as indicated. c, Diagram showing feedback regulation of purine synthesis. Adenylate and guanylate purines can allosterically inhibit enzymes involved in de novo purine synthesis. PRPP, phosphoribosyl pyrophosphate; IMP, inosine monophosphate. d, Absolute quantification of intracellular NTPs in A549 cells treated with the indicated concentrations of G, A, thymidine (T), or cytidine (C). Also indicated is whether supplementing culture media with that concentration of G, A, T and/or C does (Y) or does not (N) allow cell proliferation. e, Absolute quantification of intracellular dNTPs in A549 cells treated with the indicated concentrations of G, A, T, or C. Also indicated is whether supplementing culture media with that concentration of G, A, T and/or C does (Y) or does not (N) allow cell proliferation. f, Absolute quantification of intracellular NTPs in A549 cells and U2OS cells treated with the indicated concentrations of G or A. Also indicated is whether supplementing culture media with that concentration of G or A does (Y) or does not (N) allow cell proliferation. The data from A549 Untreated (Untr.), 200 µM G, and 2.5 mM A samples are the same as shown in panel d. g, Absolute quantification of intracellular dNTPs in A549 cells and U2OS cells treated with the indicated concentrations of G or A. Also indicated is whether supplementing culture media with that concentration of G or A does (Y) or does not (N) allow cell proliferation. The data from A549 Untr., 200 µM G, and 2.5 mM A samples are the same as shown in panel e. h, Proliferation rates of H1299, 143B, U2OS, MDA-MB-468, and RPE-1 cells in standard culture conditions (None) or treated with 200 µM G with or without 200 µM A, or 500 µM G with or without 500 µM A for RPE-1 cells, as indicated. All nucleotide levels were measured using LCMS. Data are presented as mean + /- SD of 3 biological replicates. Source numerical data are available in source data.

