Figure 2.

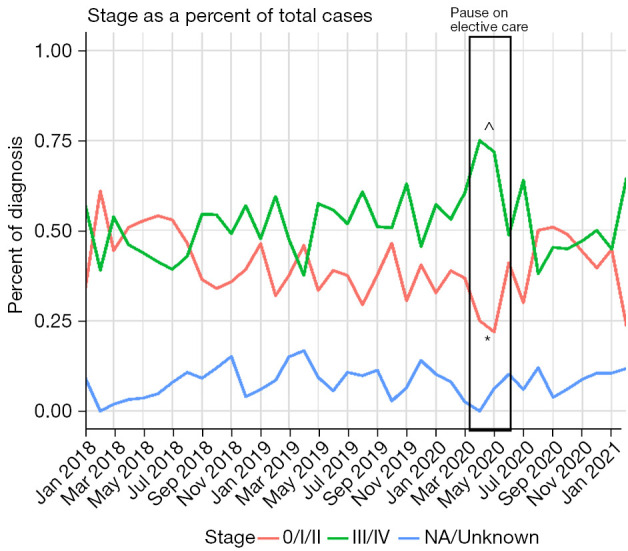
Distribution of lung cancer stage at diagnosis by month. Welch test P value versus predicted values in time-series analysis (ARIMA): *=0.02309, ^=0.02541.

Distribution of lung cancer stage at diagnosis by month. Welch test P value versus predicted values in time-series analysis (ARIMA): *=0.02309, ^=0.02541.