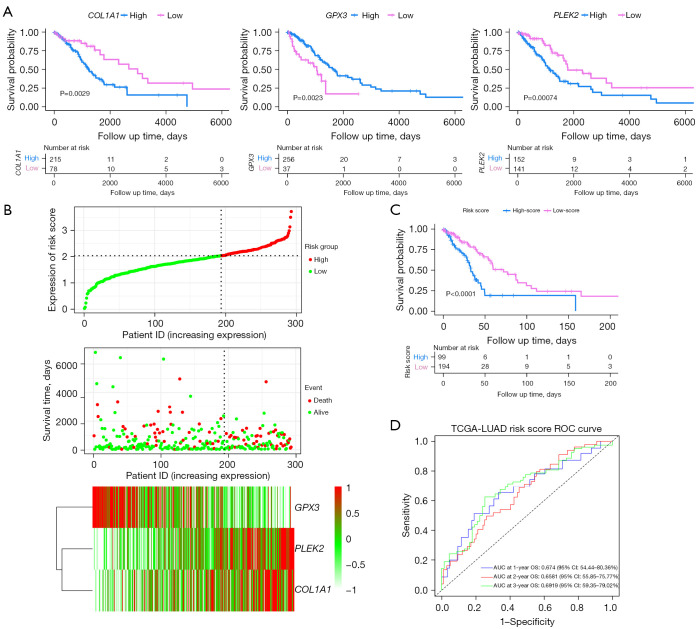
Figure 3.
Development of the gene signatures and performance evaluation in TCGA dataset. (A) Survival analysis of candidate genes in TCGA-LUAD datasets. (B) Distribution of the risk score, survival status of patients, and the mRNA expression heatmap in TCGA dataset. (C) Survival analysis of the gene signature. Patients from TCGA dataset were divided into two groups according to the optimal cut-off values of the risk scores calculated by X-tile. (D) ROC curves of the 1-, 2-, and 3-year OS of the gene signature. TCGA, The Cancer Genome Atlas; LUAD, lung adenocarcinoma; ROC, receiver operating characteristic; AUC, area under the ROC curve; OS, overall survival; CI, confidence interval; mRNA, messenger RNA.

