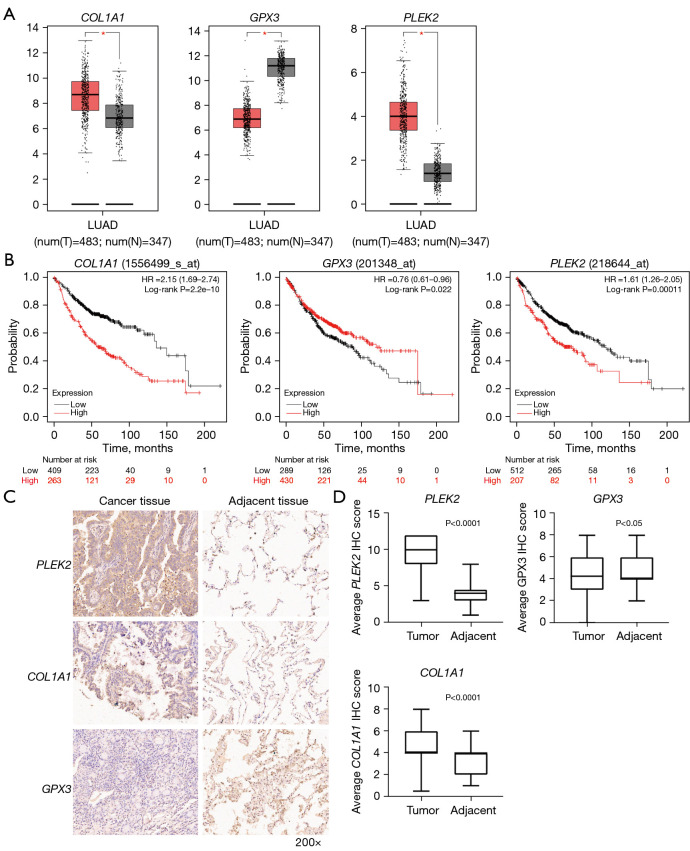
Figure 4.
Prognostic genes validation with GEPIA and the KM plotter. (A) COL1A1 and PLEK2 had higher expression levels in the LUAD specimen compared to the normal specimen, while GPX3 had the opposite expression in the GEPIA tumor database. T, tumor tissues (red); N, normal tissues (gray). *, P<0.05. (B) The prognostic information of the three genes in LUAD was demonstrated using the KM plotter. The red curve represents the high expression group, and the black curve represents the low expression group. The representative IHC images and prognostic scores of the genes in LUAD vs. adjacent tissue. (C) Expression of PLEK2, COL1A1, and GPX3 in LUAD tissue and adjacent tissue (DAB/hematoxylin staining; magnification 200×). (D) The expression levels of the three genes were analyzed in 98 LUAD tissues and 80 adjacent tissues. PLEK2 and COL1A1 were more highly expressed in LUAD tissue, while GPX3 exhibited an opposite expression trend (P<0.05). LUAD, lung adenocarcinoma; HR, hazard ratio; IHC, immunohistochemistry; GEPIA, Gene Expression Profiling Interactive Analysis; KM, Kaplan-Meier; DAB, diaminobenzidine.

